

mTOR pathway is activated by PKA in adrenocortical cells and participates in vivo to apoptosis resistance in primary pigmented nodular adrenocortical disease (PPNAD)
- PMID: 24865460
- PMCID: PMC4184389
- DOI: 10.1093/hmg/ddu265
mTOR pathway is activated by PKA in adrenocortical cells and participates in vivo to apoptosis resistance in primary pigmented nodular adrenocortical disease (PPNAD)
Abstract
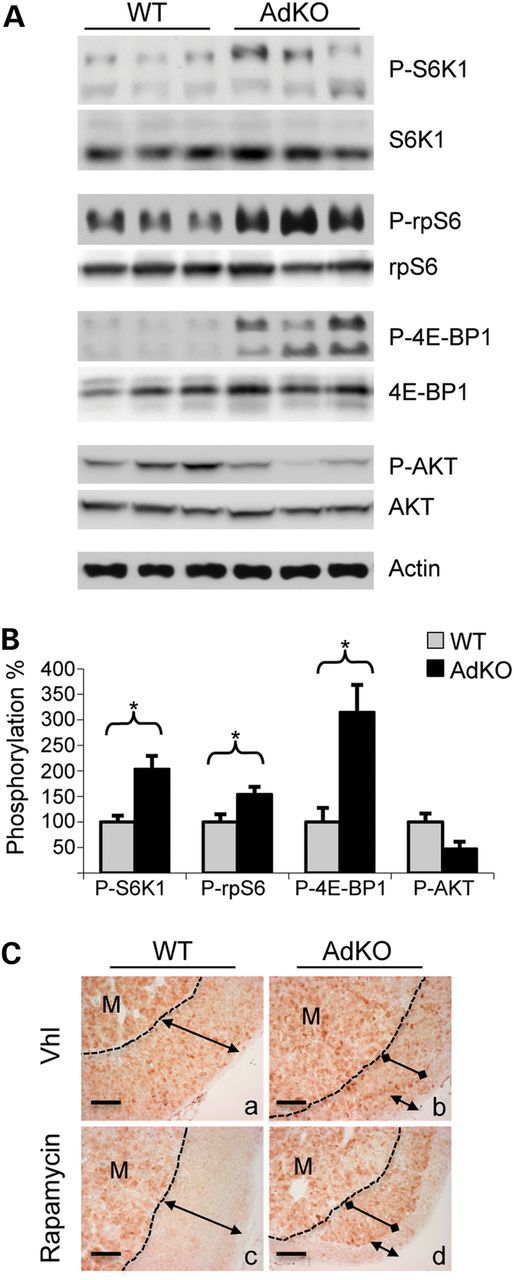
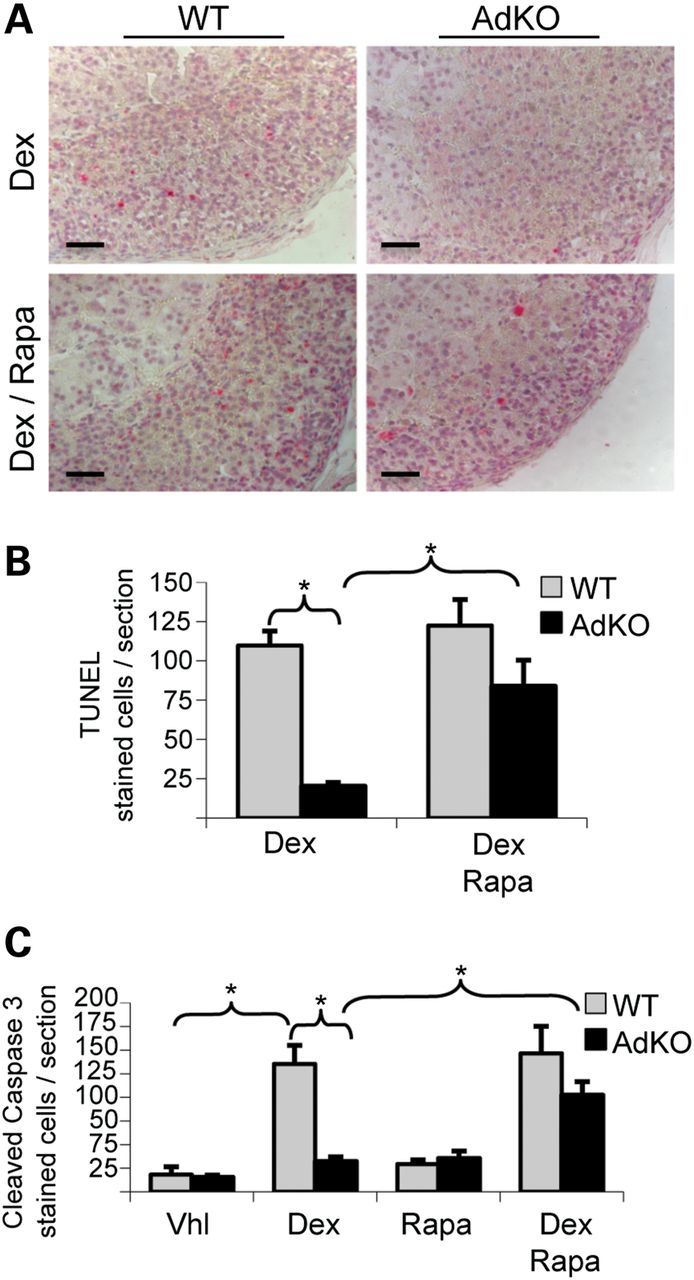
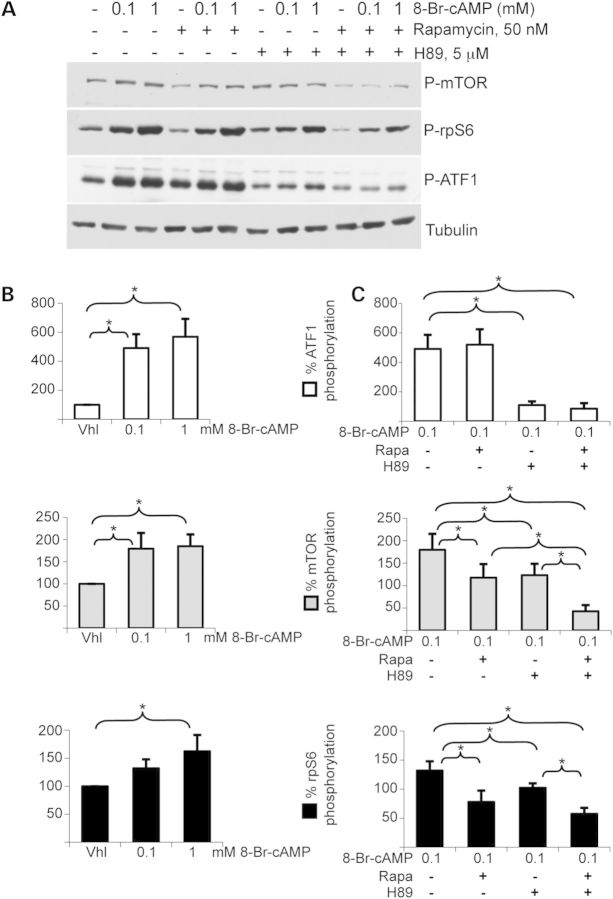
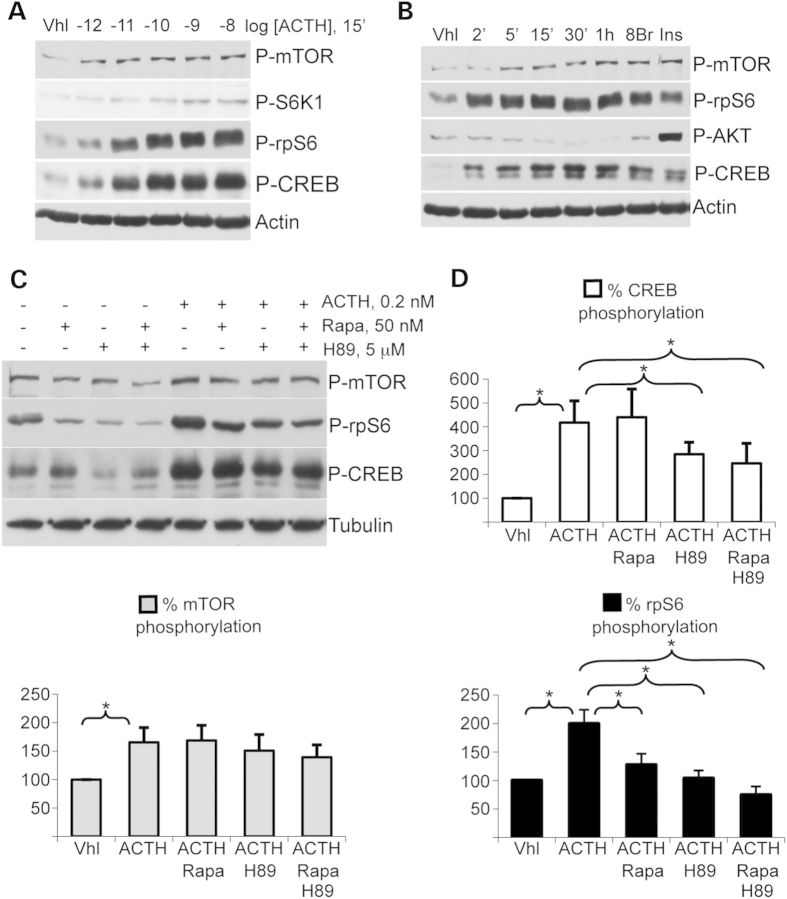
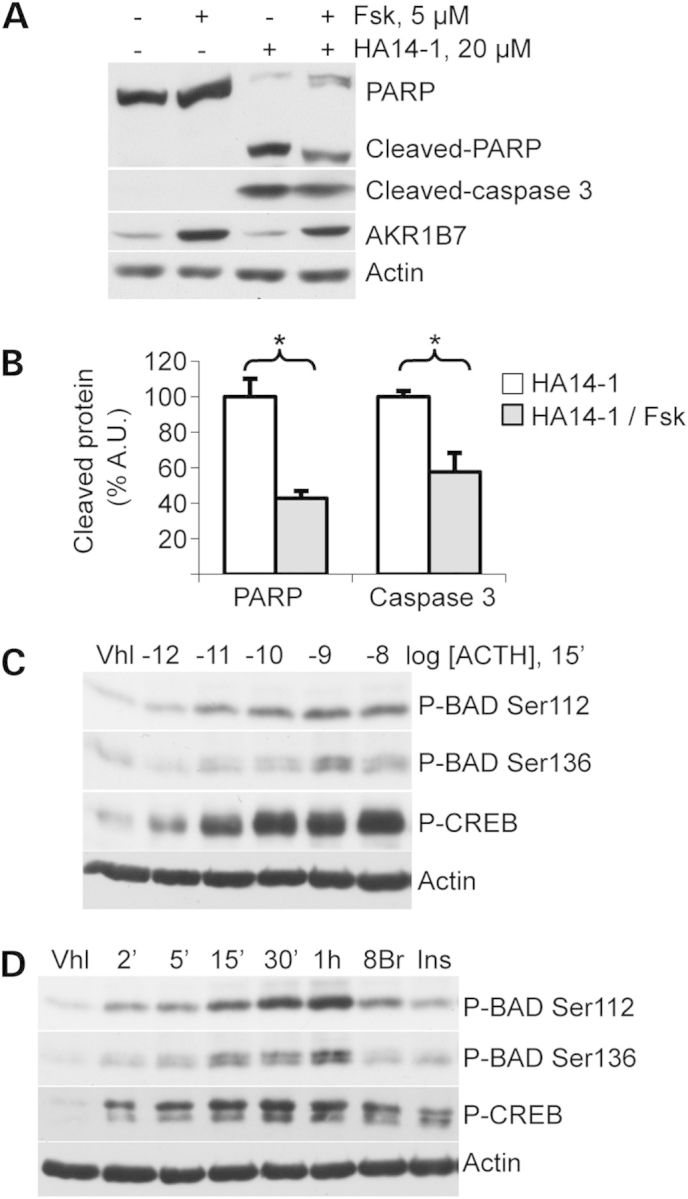
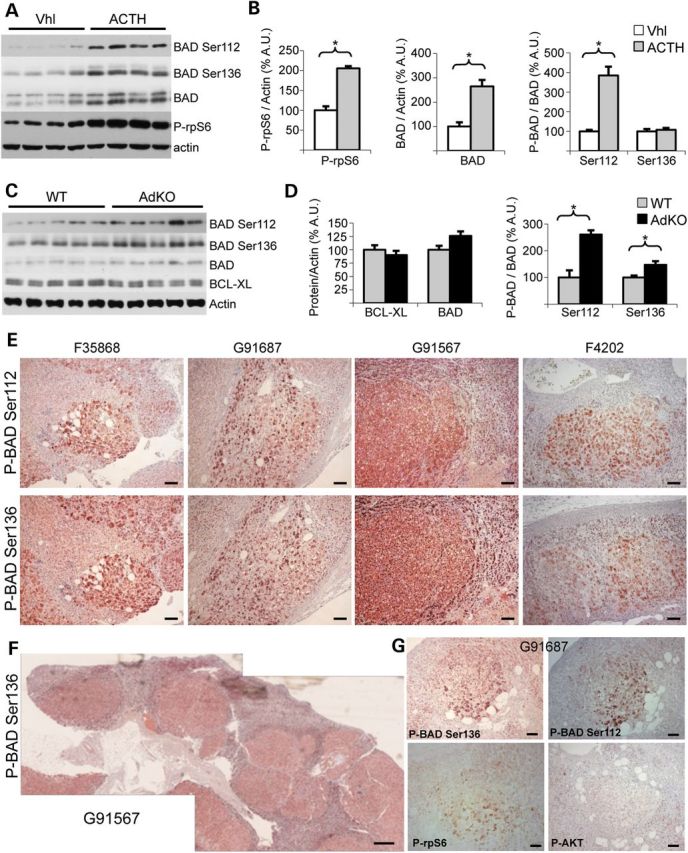
Primary pigmented nodular adrenocortical disease (PPNAD) is associated with inactivating mutations of the PRKAR1A tumor suppressor gene that encodes the regulatory subunit R1α of the cAMP-dependent protein kinase (PKA). In human and mouse adrenocortical cells, these mutations lead to increased PKA activity, which results in increased resistance to apoptosis that contributes to the tumorigenic process. We used in vitro and in vivo models to investigate the possibility of a crosstalk between PKA and mammalian target of rapamycin (mTOR) pathways in adrenocortical cells and its possible involvement in apoptosis resistance. Impact of PKA signaling on activation of the mTOR pathway and apoptosis was measured in a mouse model of PPNAD (AdKO mice), in human and mouse adrenocortical cell lines in response to pharmacological inhibitors and in PPNAD tissues by immunohistochemistry. AdKO mice showed increased mTOR complex 1 (mTORC1) pathway activity. Inhibition of mTORC1 by rapamycin restored sensitivity of adrenocortical cells to apoptosis in AdKO but not in wild-type mice. In both cell lines and mouse adrenals, rapid phosphorylation of mTORC1 targets including BAD proapoptotic protein was observed in response to PKA activation. Accordingly, BAD hyperphosphorylation, which inhibits its proapoptotic activity, was increased in both AdKO mouse adrenals and human PPNAD tissues. In conclusion, mTORC1 pathway is activated by PKA signaling in human and mouse adrenocortical cells, leading to increased cell survival, which is correlated with BAD hyperphosphorylation. These alterations could be causative of tumor formation.
© The Author 2014. Published by Oxford University Press. All rights reserved. For Permissions, please email: journals.permissions@oup.com.
Figures
Similar articles
-
PKA regulatory subunit 1A inactivating mutation induces serotonin signaling in primary pigmented nodular adrenal disease.JCI Insight. 2016 Sep 22;1(15):e87958. doi: 10.1172/jci.insight.87958. JCI Insight. 2016. PMID: 27699247 Free PMC article.
-
Depletion of type IA regulatory subunit (RIalpha) of protein kinase A (PKA) in mammalian cells and tissues activates mTOR and causes autophagic deficiency.Hum Mol Genet. 2006 Oct 1;15(19):2962-71. doi: 10.1093/hmg/ddl239. Epub 2006 Sep 8. Hum Mol Genet. 2006. PMID: 16963469
-
PRKAR1A mutations in primary pigmented nodular adrenocortical disease.Pituitary. 2006;9(3):211-9. doi: 10.1007/s11102-006-0266-1. Pituitary. 2006. PMID: 17036196 Review.
-
Cushing's syndrome and fetal features resurgence in adrenal cortex-specific Prkar1a knockout mice.PLoS Genet. 2010 Jun 10;6(6):e1000980. doi: 10.1371/journal.pgen.1000980. PLoS Genet. 2010. PMID: 20548949 Free PMC article.
-
Bilateral Adrenocortical Nodular Disease and Cushing's Syndrome.J Clin Endocrinol Metab. 2024 Sep 16;109(10):2422-2432. doi: 10.1210/clinem/dgae419. J Clin Endocrinol Metab. 2024. PMID: 38888184 Review.
Cited by
-
Mouse Models Recapitulating Human Adrenocortical Tumors: What Is Lacking?Front Endocrinol (Lausanne). 2016 Jul 15;7:93. doi: 10.3389/fendo.2016.00093. eCollection 2016. Front Endocrinol (Lausanne). 2016. PMID: 27471492 Free PMC article. Review.
-
Protein kinase A drives paracrine crisis and WNT4-dependent testis tumor in Carney complex.J Clin Invest. 2021 Dec 1;131(23):e146910. doi: 10.1172/JCI146910. J Clin Invest. 2021. PMID: 34850745 Free PMC article.
-
The transient cortical zone in the adrenal gland: the mystery of the adrenal X-zone.J Endocrinol. 2019 Apr;241(1):R51-R63. doi: 10.1530/JOE-18-0632. J Endocrinol. 2019. PMID: 30817316 Free PMC article. Review.
-
Illicit Upregulation of Serotonin Signaling Pathway in Adrenals of Patients With High Plasma or Intra-Adrenal ACTH Levels.J Clin Endocrinol Metab. 2019 Nov 1;104(11):4967-4980. doi: 10.1210/jc.2019-00425. J Clin Endocrinol Metab. 2019. PMID: 31074783 Free PMC article.
-
The mammalian target of rapamycin (mTOR) kinase mediates haloperidol-induced cataleptic behavior.Transl Psychiatry. 2020 Oct 2;10(1):336. doi: 10.1038/s41398-020-01014-x. Transl Psychiatry. 2020. PMID: 33009372 Free PMC article.
References
-
- Shenoy B.V., Carpenter P.C., Carney J.A. Bilateral primary pigmented nodular adrenocortical disease. Rare cause of the Cushing syndrome. Am. J. Surg. Pathol. 1984;8:335–344. - PubMed
-
- Carney J.A., Gordon H., Carpenter P.C., Shenoy B.V., Go V.L. The complex of myxomas, spotty pigmentation, and endocrine overactivity. Medicine (Baltimore) 1985;64:270–283. - PubMed
-
- Kirschner L.S., Carney J.A., Pack S.D., Taymans S.E., Giatzakis C., Cho Y.S., Cho-Chung Y.S., Stratakis C.A. Mutations of the gene encoding the protein kinase A type I-alpha regulatory subunit in patients with the Carney complex. Nat. Genet. 2000;26:89–92. - PubMed
-
- Horvath A., Boikos S., Giatzakis C., Robinson-White A., Groussin L., Griffin K.J., Stein E., Levine E., Delimpasi G., Hsiao H.P., et al. A genome-wide scan identifies mutations in the gene encoding phosphodiesterase 11A4 (PDE11A) in individuals with adrenocortical hyperplasia. Nat. Genet. 2006;38:794–800. - PubMed
Publication types
MeSH terms
Substances
LinkOut - more resources
Full Text Sources
Other Literature Sources
Molecular Biology Databases
Research Materials
Miscellaneous
