

Speciation and demographic history of Atlantic eels (Anguilla anguilla and A. rostrata) revealed by mitogenome sequencing
- PMID: 24865601
- PMCID: PMC4220719
- DOI: 10.1038/hdy.2014.44
Speciation and demographic history of Atlantic eels (Anguilla anguilla and A. rostrata) revealed by mitogenome sequencing
Abstract
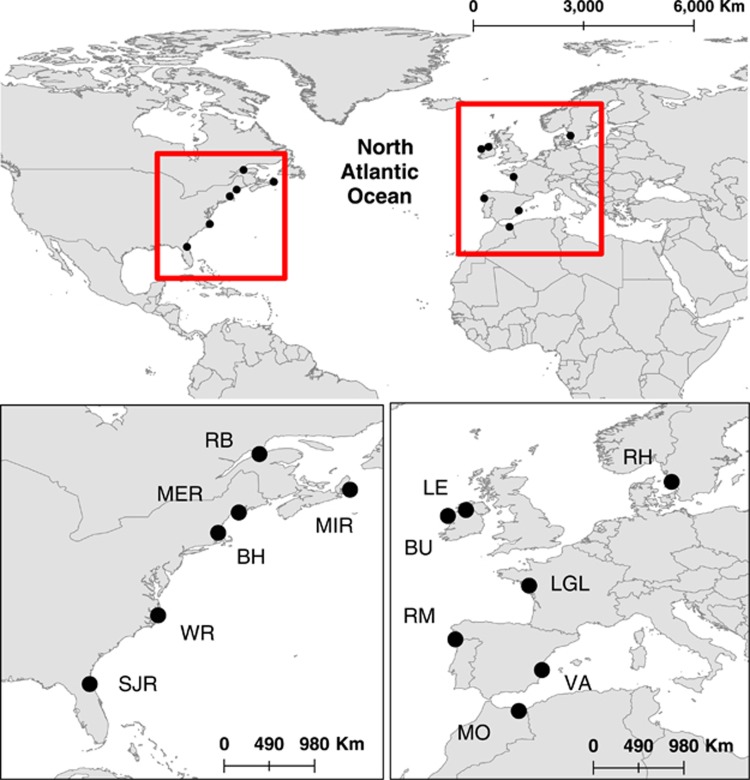
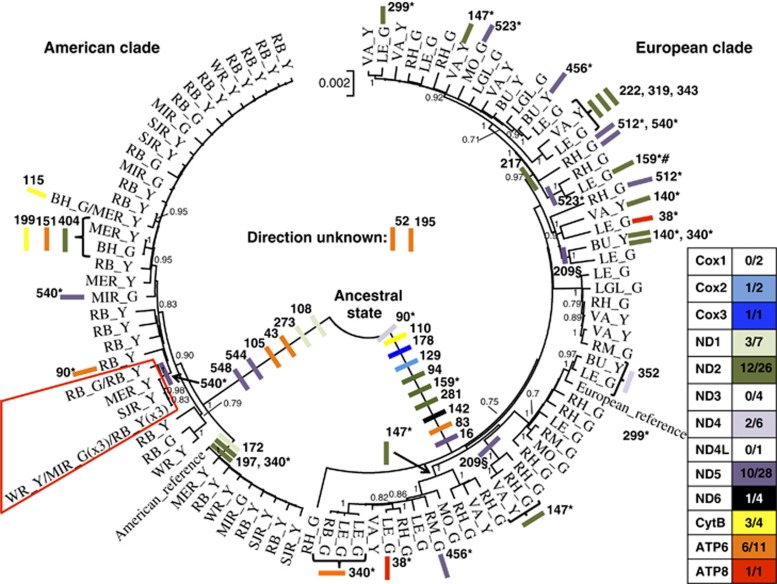
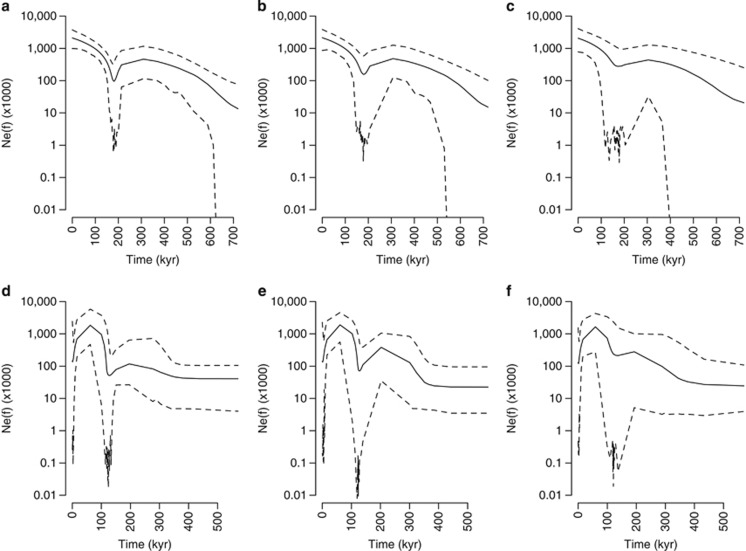
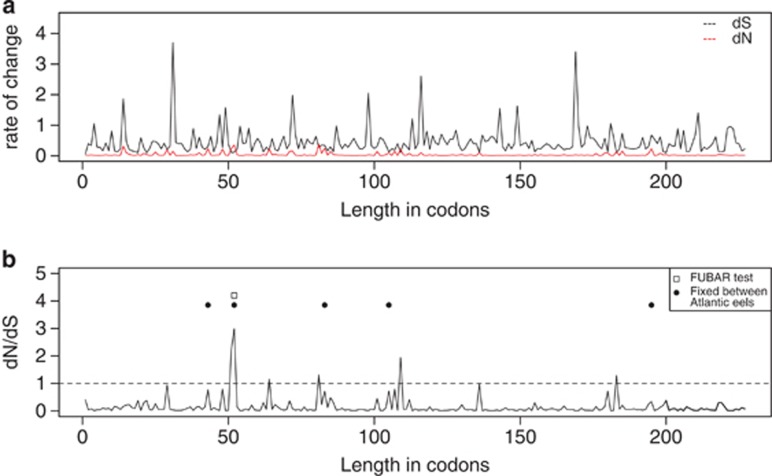
Processes leading to speciation in oceanic environments without obvious physical barriers remain poorly known. European and American eel (Anguilla anguilla and A. rostrata) spawn in partial sympatry in the Sargasso Sea. Larvae are advected by the Gulf Stream and other currents towards the European/North African and North American coasts, respectively. We analyzed 104 mitogenomes from the two species along with mitogenomes of other Anguilla and outgroup species. We estimated divergence time between the two species to identify major events involved in speciation. We also considered two previously stated hypotheses: one where the ancestral species was present in only one continent but was advected across the Atlantic by ocean current changes and another where population declines during Pleistocene glaciations led to increasing vicariance, facilitating speciation. Divergence time was estimated to ∼3.38 Mya, coinciding with the closure of the Panama Gateway that led to reinforcement of the Gulf Stream. This could have advected larvae towards European/North African coasts, in which case American eel would be expected to be the ancestral species. This scenario could, however, not be unequivocally confirmed by analyses of dN/dS, nucleotide diversity and effective population size estimates. Extended bayesian skyline plots showed fluctuations of effective population sizes and declines during glaciations, and thus also lending support to the importance of vicariance during speciation. There was evidence for positive selection at the ATP6 and possibly ND5 genes, indicating a role in speciation. The findings suggest an important role of ocean current changes in speciation of marine organisms.
Figures
References
-
- Albert V, Jonsson B, Bernatchez L. Natural hybrids in Atlantic eels (Anguilla anguilla, A-rostrata): evidence for successful reproduction and fluctuating abundance in space and time. Mol Ecol. 2006;15:1903–1916. - PubMed
-
- Als TD, Hansen MM, Maes GE, Castonguay M, Riemann L, Aarestrup K, et al. All roads lead to home: panmixia of European eel in the Sargasso Sea. Mol Ecol. 2011;20:1333–1346. - PubMed
-
- Alves-Gomes JA. Systematic biology of gymnotiform and mormyriform electric fishes: phylogenetic relationships, molecular clocks and rates of evolution in the mitochondrial rRNA genes. J Exp Biol. 1999;202:1167–1183. - PubMed
-
- Avise JC, Ball RM, Arnold J. Current versus historical population sizes in vertebrate species with high gene flow—a comparison based on mitochondrial-DNA lineages and inbreeding theory for neutral mutations. Mol Biol Evol. 1988;5:331–344. - PubMed
Publication types
MeSH terms
Associated data
- Actions
- Actions
- Actions
- Actions
- Actions
- Actions
- Actions
- Actions
- Actions
- Actions
- Actions
- Actions
- Actions
- Actions
- Actions
- Actions
- Actions
- Actions
- Actions
- Actions
- Actions
- Actions
- Actions
- Actions
- Actions
- Actions
- Actions
- Actions
- Actions
- Actions
- Actions
- Actions
- Actions
- Actions
- Actions
- Actions
- Actions
- Actions
- Actions
- Actions
- Actions
- Actions
- Actions
- Actions
- Actions
- Actions
- Actions
- Actions
- Actions
- Actions
- Actions
- Actions
- Actions
- Actions
- Actions
- Actions
- Actions
- Actions
- Actions
- Actions
- Actions
- Actions
- Actions
- Actions
- Actions
- Actions
- Actions
- Actions
- Actions
- Actions
- Actions
- Actions
- Actions
- Actions
- Actions
- Actions
- Actions
- Actions
- Actions
- Actions
- Actions
- Actions
- Actions
- Actions
- Actions
- Actions
- Actions
- Actions
- Actions
- Actions
- Actions
- Actions
- Actions
- Actions
- Actions
- Actions
- Actions
- Actions
- Actions
- Actions
- Actions
- Actions
LinkOut - more resources
Full Text Sources
Other Literature Sources
