

Synaptic structure quantification in cultured neurons
- PMID: 24865645
- PMCID: PMC4318557
- DOI: 10.1002/0471140856.tx1222s60
Synaptic structure quantification in cultured neurons
Abstract
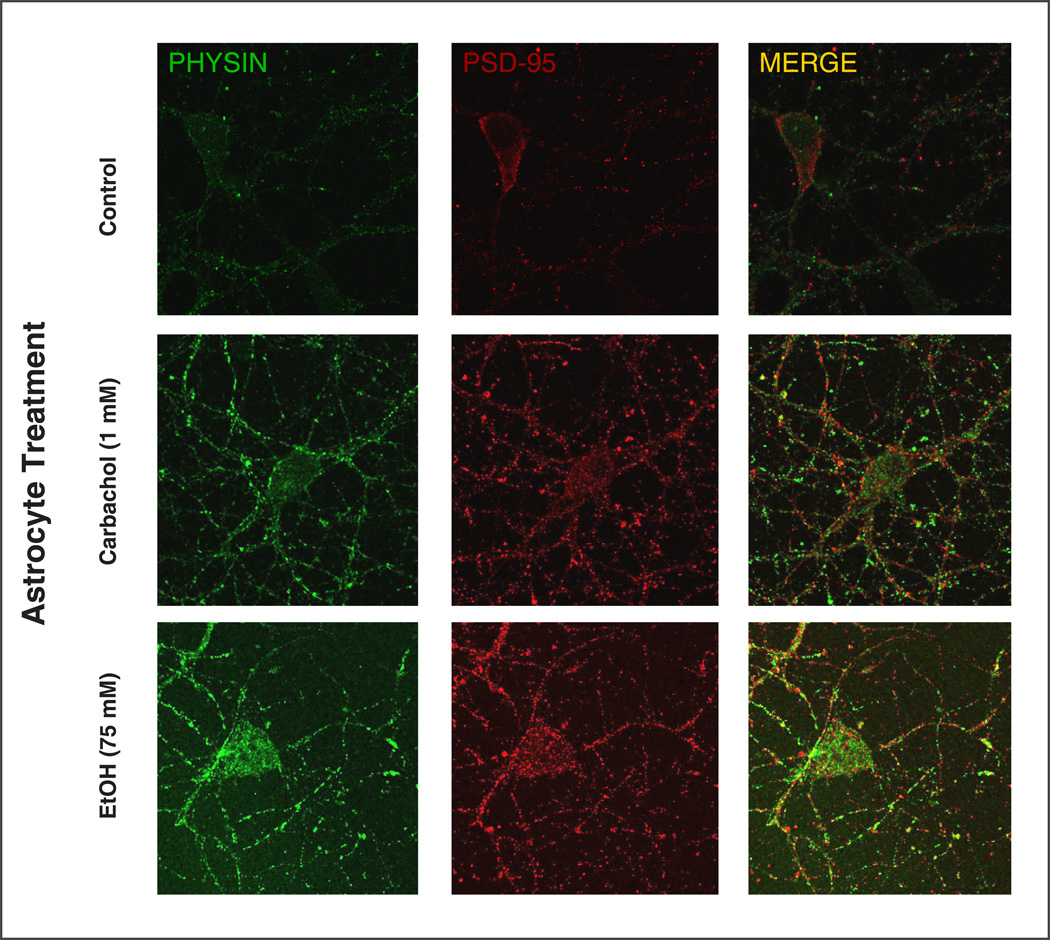
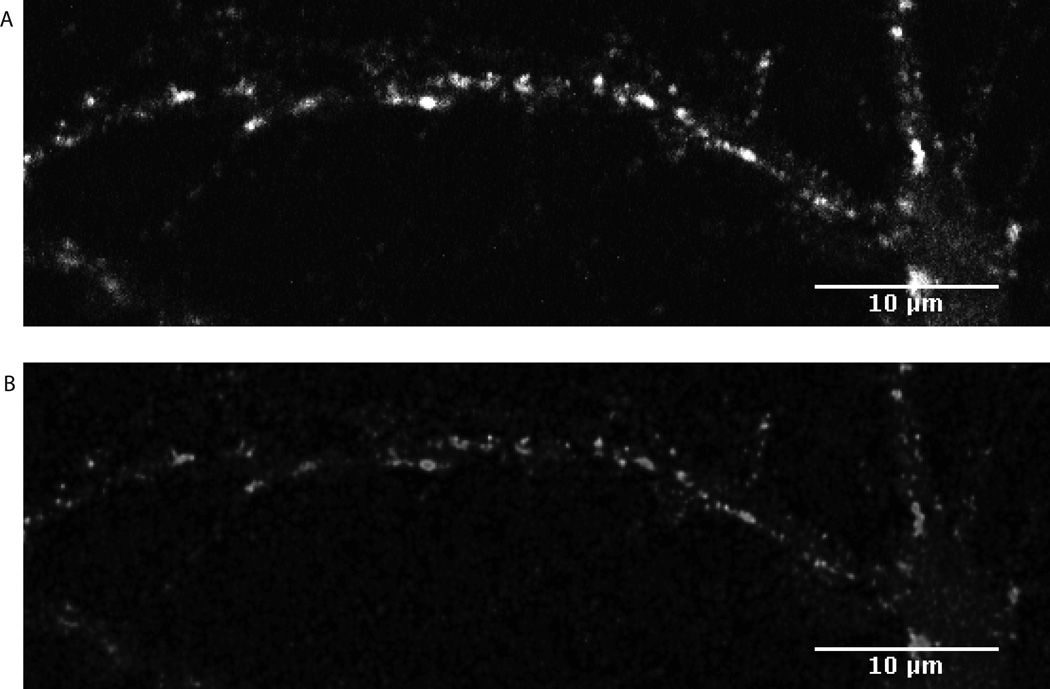
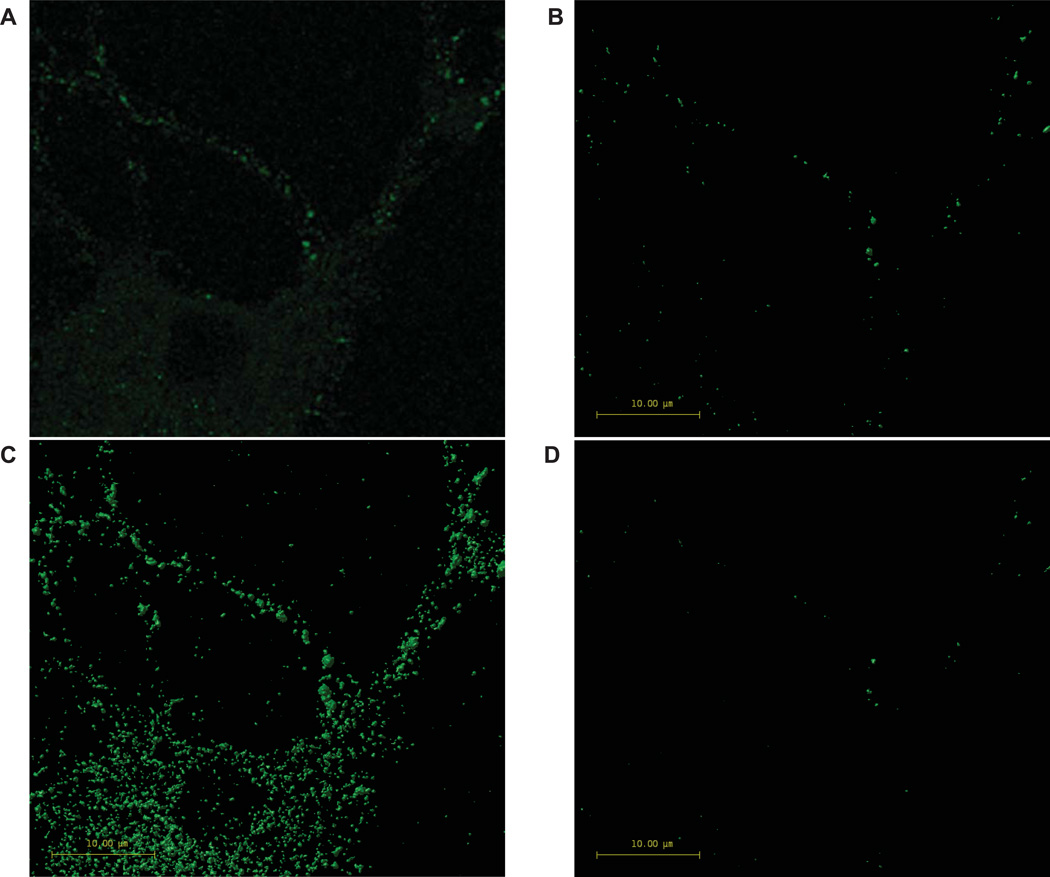
Behavioral problems (e.g., learning and memory) following developmental exposure to toxicants suggests that dysregulation of the process of synapse formation and function may occur. The ability to assess these changes is thus of value. This unit describes a method to investigate toxicant-induced changes to synaptic structure formation in primary hippocampal neurons using immunocytochemical labeling of the pre- and post-synaptic markers synaptophysin and PSD-95, confocal imaging, and three-dimensional object analysis. Protocols for the long-term culturing of primary hippocampal neurons and of primary cortical astrocytes, as well as their co-culture, are included. While the described methods focus on how astrocytes influence synapse formation and how toxicants may interfere in this process, modifications to the experimental plan can easily be implemented. This would allow for the investigation of the effects of toxicants after treating neurons alone, or both astrocytes and neurons in co-culture. With the common endpoint of synapse structure formation, differences between varying treatment paradigms can expand the understanding of the influence of particular toxicants on these diverse cell types and provide insight into potential mechanisms of effect and the contributions of each to synapse formation.
Keywords: 3-dimensional analysis; PSD-95; astrocytes; sandwich co-culture; synaptogenesis; synaptophysin.
Copyright © 2014 John Wiley & Sons, Inc.
Figures
References
-
- Banker GA, Cowan M. Rat hippocampal neurons in dispersed cell culture. Brain Research. 1977;126:397–425. - PubMed
-
- Barres BA. The mystery and magic of glia: a perspective on their roles in health and disease. Neuron. 2008;60:430–440. - PubMed
-
- Bernal J. Thyroid hormone receptors in brain development and function. Nature Reviews Endrocrinology. 2007;3:249–259. - PubMed
-
- Boraso M, Viviani B. Glia-neuron sandwich cocultures: An in vitro approach to evaluate cell-to-cell communication in neuroinflammation and neurotoxicity. In: Costa LG, Giordano G, Guizzetti M, editors. In Vitro Neurotoxicology: Methods and Protocols. New York: Springer; 2011. pp. 135–152. - PubMed
-
- Cannell MB, McMorland A, Soeller C. Image enhancement by deconvolution. In: Pawley JB, editor. Handbook of Biological Confocal Microscopy. 3rd ed. New York: Springer Science + Business Media; 2006. pp. 488–497.
Publication types
MeSH terms
Grants and funding
- P30ES-07033/ES/NIEHS NIH HHS/United States
- R01 AA017180/AA/NIAAA NIH HHS/United States
- P42 ES-04696/ES/NIEHS NIH HHS/United States
- R21 ES-022611/ES/NIEHS NIH HHS/United States
- R01 AA-17180/AA/NIAAA NIH HHS/United States
- F31 AA019868/AA/NIAAA NIH HHS/United States
- R01 AA-08154/AA/NIAAA NIH HHS/United States
- P01 ES009601/ES/NIEHS NIH HHS/United States
- R01 AA008154/AA/NIAAA NIH HHS/United States
- R21 ES022611/ES/NIEHS NIH HHS/United States
- F31 AA-019868/AA/NIAAA NIH HHS/United States
- P42 ES004696/ES/NIEHS NIH HHS/United States
- R01 ES-022949/ES/NIEHS NIH HHS/United States
- R01 ES022949/ES/NIEHS NIH HHS/United States
- P30 ES007033/ES/NIEHS NIH HHS/United States
- P50 ES-09601/ES/NIEHS NIH HHS/United States
LinkOut - more resources
Full Text Sources
Other Literature Sources
