

Basilar membrane and tectorial membrane stiffness in the CBA/CaJ mouse
- PMID: 24865766
- PMCID: PMC4164692
- DOI: 10.1007/s10162-014-0463-y
Basilar membrane and tectorial membrane stiffness in the CBA/CaJ mouse
Abstract
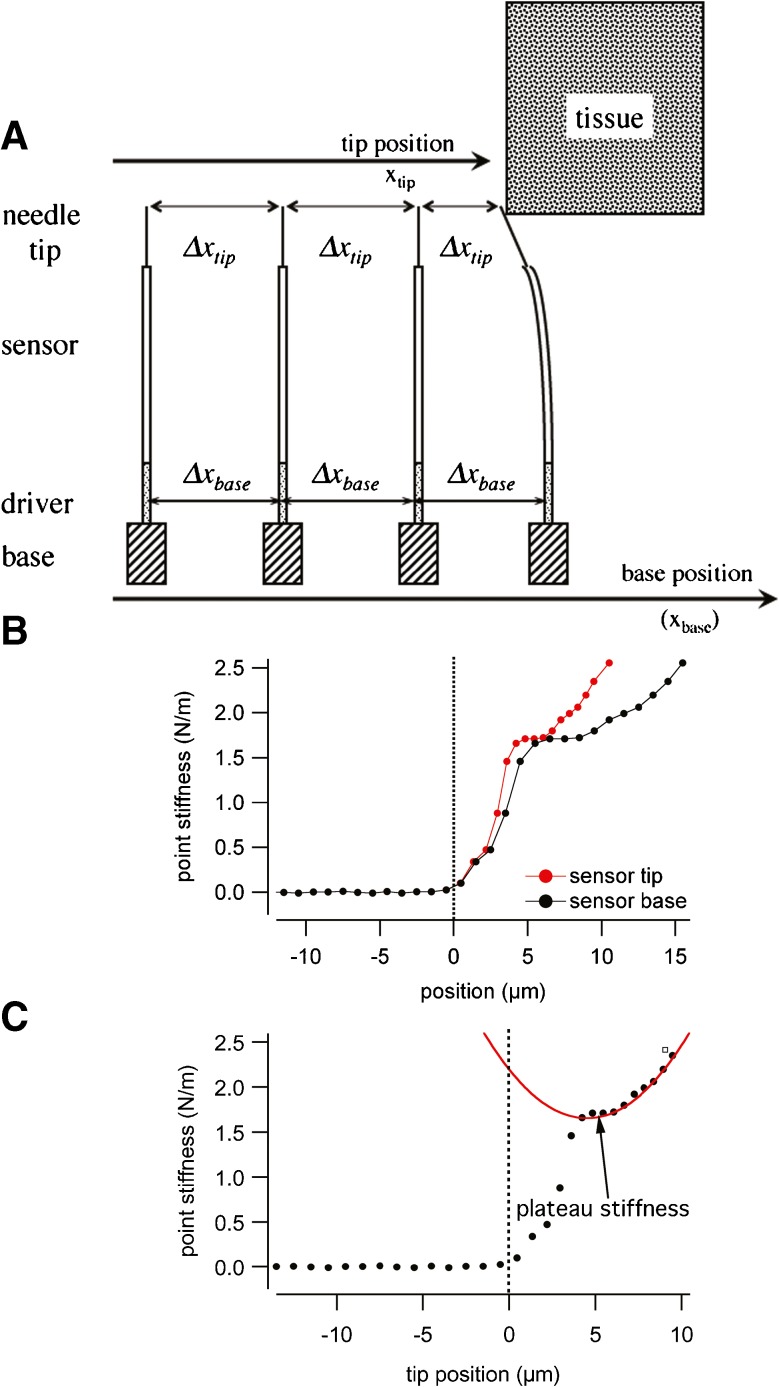
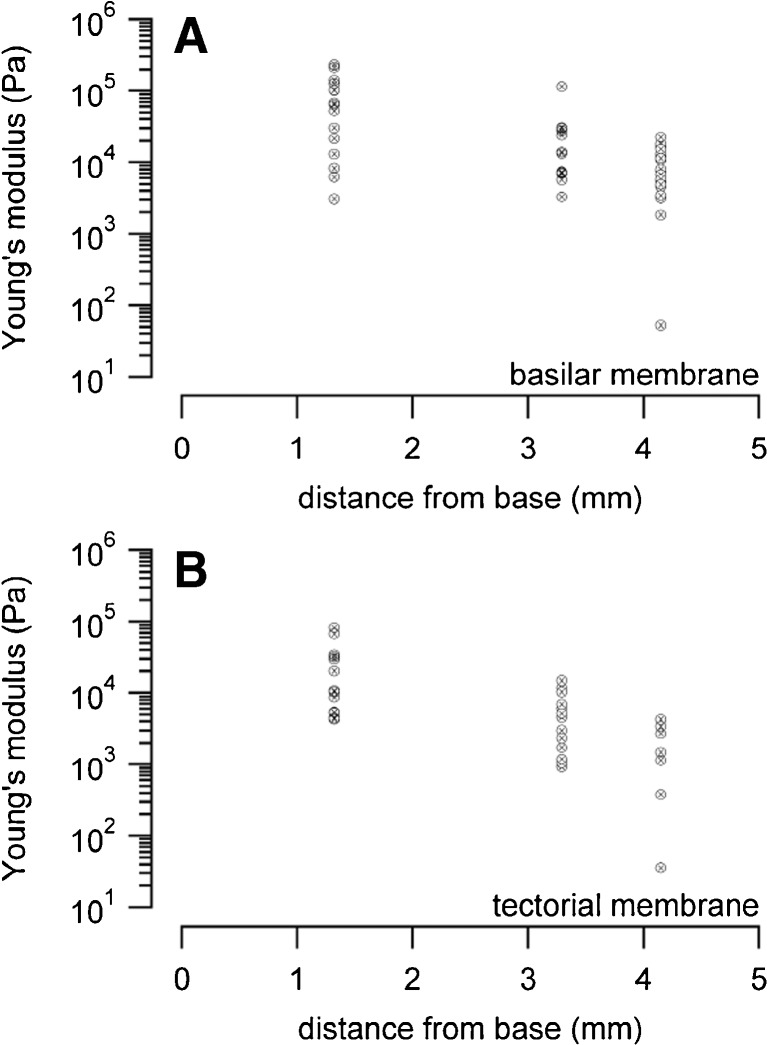
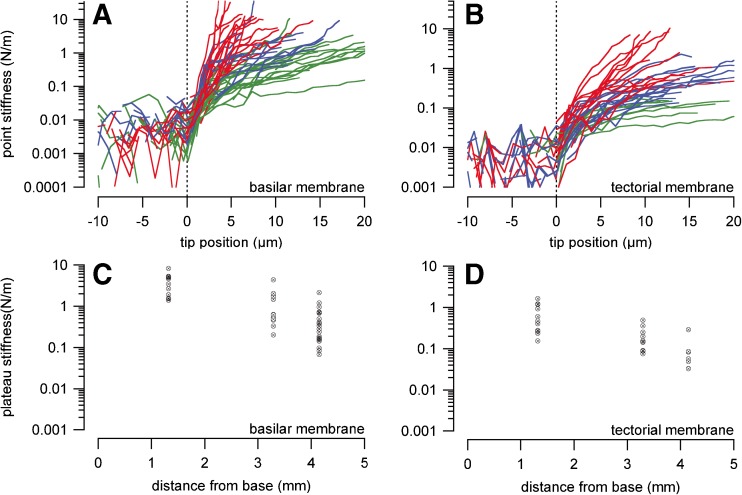
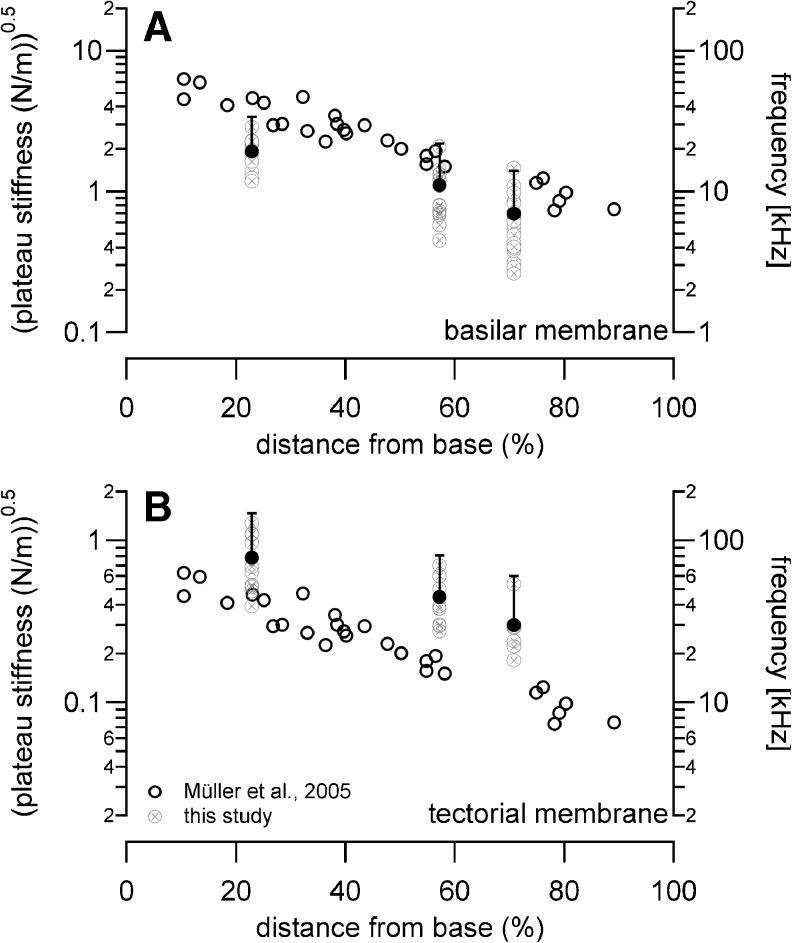
The mouse has become an important animal model in understanding cochlear function. Structures, such as the tectorial membrane or hair cells, have been changed by gene manipulation, and the resulting effect on cochlear function has been studied. To contrast those findings, physical properties of the basilar membrane (BM) and tectorial membrane (TM) in mice without gene mutation are of great importance. Using the hemicochlea of CBA/CaJ mice, we have demonstrated that tectorial membrane (TM) and basilar membrane (BM) revealed a stiffness gradient along the cochlea. While a simple spring mass resonator predicts the change in the characteristic frequency of the BM, the spring mass model does not predict the frequency change along the TM. Plateau stiffness values of the TM were 0.6 ± 0.5, 0.2 ± 0.1, and 0.09 ± 0.09 N/m for the basal, middle, and upper turns, respectively. The BM plateau stiffness values were 3.7 ± 2.2, 1.2 ± 1.2, and 0.5 ± 0.5 N/m for the basal, middle, and upper turns, respectively. Estimations of the TM Young's modulus (in kPa) revealed 24.3 ± 25.2 for the basal turns, 5.1 ± 4.5 for the middle turns, and 1.9 ± 1.6 for the apical turns. Young's modulus determined at the BM pectinate zone was 76.8 ± 72, 23.9 ± 30.6, and 9.4 ± 6.2 kPa for the basal, middle, and apical turns, respectively. The reported stiffness values of the CBA/CaJ mouse TM and BM provide basic data for the physical properties of its organ of Corti.
Figures
Similar articles
-
The effect of tectorial membrane and basilar membrane longitudinal coupling in cochlear mechanics.J Acoust Soc Am. 2010 Mar;127(3):1411-21. doi: 10.1121/1.3290995. J Acoust Soc Am. 2010. PMID: 20329841 Free PMC article.
-
Tectorial membrane stiffness gradients.Biophys J. 2007 Sep 15;93(6):2265-76. doi: 10.1529/biophysj.106.094474. Epub 2007 May 11. Biophys J. 2007. PMID: 17496047 Free PMC article.
-
Two-compartment passive frequency domain cochlea model allowing independent fluid coupling to the tectorial and basilar membranes.J Acoust Soc Am. 2015 Mar;137(3):1117-25. doi: 10.1121/1.4908214. J Acoust Soc Am. 2015. PMID: 25786927 Free PMC article.
-
The interplay of organ-of-Corti vibrational modes, not tectorial- membrane resonance, sets outer-hair-cell stereocilia phase to produce cochlear amplification.Hear Res. 2020 Sep 15;395:108040. doi: 10.1016/j.heares.2020.108040. Epub 2020 Jul 30. Hear Res. 2020. PMID: 32784038 Free PMC article. Review.
-
The tectorial membrane of mammals.Hear Res. 1983 Mar;9(3):327-59. doi: 10.1016/0378-5955(83)90035-7. Hear Res. 1983. PMID: 6341342 Review. No abstract available.
Cited by
-
Consequences of Location-Dependent Organ of Corti Micro-Mechanics.PLoS One. 2015 Aug 28;10(8):e0133284. doi: 10.1371/journal.pone.0133284. eCollection 2015. PLoS One. 2015. PMID: 26317521 Free PMC article.
-
Two passive mechanical conditions modulate power generation by the outer hair cells.PLoS Comput Biol. 2017 Sep 7;13(9):e1005701. doi: 10.1371/journal.pcbi.1005701. eCollection 2017 Sep. PLoS Comput Biol. 2017. PMID: 28880884 Free PMC article.
-
Mitochondrial form and function in hair cells.Hear Res. 2023 Feb;428:108660. doi: 10.1016/j.heares.2022.108660. Epub 2022 Nov 25. Hear Res. 2023. PMID: 36525891 Free PMC article. Review.
-
Development of the cochlea.Development. 2020 Jun 22;147(12):dev162263. doi: 10.1242/dev.162263. Development. 2020. PMID: 32571852 Free PMC article. Review.
-
Frequency sensitivity in mammalian hearing from a fundamental nonlinear physics model of the inner ear.Sci Rep. 2017 Aug 30;7(1):9931. doi: 10.1038/s41598-017-09854-2. Sci Rep. 2017. PMID: 28855554 Free PMC article.
References
-
- Abnet CC, Freeman DM. Deformations of the isolated mouse tectorial membrane produced by oscillatory forces. Hear Res. 2000;144:29–46. - PubMed
-
- Allaire P, Raynor S, Billione M. Cochlear partition stiffness—a composite model. J Acoust Soc Am. 1974;55:1252–1258. - PubMed
-
- Barral J, Martin P. The physical basis of active mechanosensitivity by the hair-cell bundle. Curr Opin Otolaryngol Head Neck Surg. 2011;19:369–375. - PubMed
Publication types
MeSH terms
Grants and funding
LinkOut - more resources
Full Text Sources
Other Literature Sources
