. 2014 Aug;34(15):2857-73.
doi: 10.1128/MCB.00333-14. Epub 2014 May 27.

HuR regulates alternative splicing of the TRA2β gene in human colon cancer cells under oxidative stress

Affiliations

HuR regulates alternative splicing of the TRA2β gene in human colon cancer cells under oxidative stress

Yoko Akaike et al. Mol Cell Biol. 2014 Aug.

Abstract

Hu antigen R (HuR) regulates stress responses through stabilizing and/or facilitating the translation of target mRNAs. The human TRA2β gene encodes splicing factor transformer 2β (Tra2β) and generates 5 mRNA isoforms (TRA2β1 to -5) through alternative splicing. Exposure of HCT116 colon cancer cells to sodium arsenite stimulated checkpoint kinase 2 (Chk2)- and mitogen-activated protein kinase p38 (p38(MAPK))-mediated phosphorylation of HuR at positions S88 and T118. This induced an association between HuR and the 39-nucleotide (nt) proximal region of TRA2β exon 2, generating a TRA2β4 mRNA that includes exon 2, which has multiple premature stop codons. HuR knockdown or Chk2/p38(MAPK) double knockdown inhibited the arsenite-stimulated production of TRA2β4 and increased Tra2β protein, facilitating Tra2β-dependent inclusion of exons in target pre-mRNAs. The effects of HuR knockdown or Chk2/p38(MAPK) double knockdown were also confirmed using a TRA2β minigene spanning exons 1 to 4, and the effects disappeared when the 39-nt region was deleted from the minigene. In endogenous HuR knockdown cells, the overexpression of a HuR mutant that could not be phosphorylated (with changes of serine to alanine at position 88 [S88A], S100A, and T118A) blocked the associated TRA2β4 interaction and TRA2β4 generation, while the overexpression of a phosphomimetic HuR (with mutations S88D, S100D, and T118D) restored the TRA2β4-related activities. Our findings revealed the potential role of nuclear HuR in the regulation of alternative splicing programs under oxidative stress.


Figures

FIG 1
FIG 1
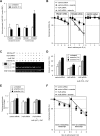
Involvement of HuR in arsenite-stimulated expression of the TRA2β4 mRNA isoform. (A) Diagram of TRA2β mRNA isoforms. The inclusion of each exon is indicated by Arabic numbers. The translation start sites in exons 1 and 4 are indicated by filled arrows and open arrows, respectively. (B) HCT116 cells were treated with 10 nM control siRNA or HuR siRNA for 48 h and then exposed to 100 μM sodium arsenite for the indicated times. RT-PCR was performed with primers specific for exons 1 and 4 or exons 3 and 4. Primer sets are indicated in the diagram. (C) Primer sets designed to measure TRA2β1, TRA2β4, or transcripts containing exons 3 and 4 (TRA2β1 + β4) are indicated in the diagram. HCT116 cells were treated with 10 nM control siRNA or HuR siRNA for 48 h and then exposed to 100 μM sodium arsenite for the indicated times. Amounts of TRA2β1, TRA2β4, and TRA2β1 plus TRA2β4 were measured by qPCR, using GAPDH mRNA as an endogenous control. Values are expressed as fold changes (means ± standard deviations [SDs], n = 5) compared with the respective values in untreated control cells (0 h). *, significantly different from the control value by Student's t test (P < 0.05). (D) Control plasmids encoding the TAP tag or plasmids encoding HuR (WT)-TAP were transfected into HCT116 cells in which endogenous HuR was silenced using siRNA targeting the 3′ UTR of HUR mRNA. Cells were left untreated or were treated with 100 μM sodium arsenite for the indicated times. Levels of TRA2β1, TRA2β4, and TRA2β1 plus TRA2β4 were measured by qPCR, using GAPDH mRNA as an endogenous control. Values are expressed as fold changes (means ± SDs, n = 5) compared with the respective values in untreated control cells (0 h). *, significantly different from the control value by one-way analysis of variance followed by Tukey's multiple-comparison test (P < 0.05). (E) HCT116 cells were treated with 10 nM control siRNA or HuR siRNA for 48 h and exposed to 100 μM sodium arsenite for the indicated times. Tra2β levels were measured by Western blotting, using GAPDH as a loading control.
FIG 2
FIG 2
Association of HuR with TRA2β4 mRNA. (A) Possible association between HuR and TRA2β4 mRNA. Cytoplasmic and nuclear lysates were prepared from HCT116 cells before (untreated) or 1 h after treatment with 100 μM sodium arsenite. HuR-associated TRA2β1 and TRA2β4 mRNAs in these lysates were isolated by RIP, and their levels were measured by qPCR and normalized to GAPDH mRNA levels. Data are expressed as fold enrichment of TRA2β1 or TRA2β4 mRNA levels in HuR IP relative to those in IgG IP. Values are means ± SDs (n = 4). (B) Effects of HuR knockdown on the stability of TRA2β1 and TRA2β4 mRNA. After exposure of control siRNA- or HuR siRNA-transfected HCT116 cells to 100 μM sodium arsenite in the presence of 2 μg/ml transcription inhibitor, actinomycin D, amounts of TRA2β1, TRA2β4, and GAPDH mRNAs were measured by qPCR and normalized to 18S rRNA levels. Data (means ± SDs, n = 3) are expressed as percentages of TRA2β1, TRA2β4, or GAPDH mRNA levels before exposure to arsenite (time zero). (C) Effects of control siRNA or HuR siRNA on alternative splicing of the MGTra minigene. Control plasmids expressing the TAP tag or plasmids expressing HuR (WT)-TAP were transfected into HCT116 cells in which endogenous HuR was silenced using siRNA targeting the 3′ UTR of HUR mRNA. Cells were transfected with MGTra-WT minigene (1 μg) for 24 h and left untreated or treated with 100 μM sodium arsenite for the indicated times. The inclusion of exon 2 and levels of transcripts containing exons 3 and 4 were analyzed by RT-PCR. (D) After treatment of HCT116 cells as explained for panel C, the percentage of exon 2 inclusion in transcripts from the MGTra-WT minigene was measured by qPCR using transcripts containing exons 3 and 4 as a quantity control. Values are means ± SDs (n = 5). (E) After treatment of HCT116 cells as explained for panel C, the amounts of transcripts derived from the MGTra minigene were analyzed by qPCR, using GAPDH mRNA as an endogenous control. Values are expressed as fold changes (means ± SDs, n = 5) compared with the respective values in untreated control cells. (F) MGTra-WT was cotransfected with control siRNA or HuR siRNA for 48 h. Cells were then treated with 100 μM sodium arsenite in the presence of 2 μg/ml transcription inhibitor, actinomycin D. The amounts of exon 2-excluding transcripts and exon 2-containing transcripts were analyzed as described for panel B.
FIG 3
FIG 3
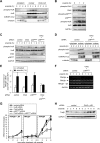
Detection of TRA2β mRNA-associated HuR. (A) Nucleotide sequence of the TRA2β exon 2 and schematic diagram of the biotinylated transcripts of TRA2β exon 1 (ex1), exon 2 (ex2), exon 3 (ex3), exon 10 (ex10), and exon 2 fragments (F1 and F2) used for biotin pulldown assays. A predicted hit of a previously identified HuR motif is depicted in boldface. (B) Biotinylated TRA2β fragments (ex1, ex2, ex3, ex10, ex2 F1, and ex2 F2) and a biotinylated fragment of the GAPDH 3′ UTR (negative control) were prepared. Associations between HuR and each fragment were tested by biotin pulldown assay using cell lysates from HCT116 cells left untreated or treated with 100 μM sodium arsenite for 2 h. Amounts of HuR in pulldown samples were measured by Western blotting using a specific anti-HuR antibody. Similar results were obtained in 3 independent experiments. (C) Schematic diagram of TRA2β exon 2 fragments 3 (F3) and 4 (F4). (D) Association of biotinylated F4 or F3 with HuR was examined by biotin pulldown assay, and F3- or F4-associated HuR was detected by Western blotting. The results are representative of 3 independent experiments. (E) Schematic diagram of TRA2β exon 2 (ex2) and exon 2 fragments (ex2 Δ39 and ex2 Δ70). (F) Associations between HuR and biotinylated exon 2, ex2 Δ39, and ex2 Δ70 were analyzed as described above. The results are representative of 3 independent experiments. (G) Schematic diagram of the TRA2β exon 2 fragments (A, B, and C). (H) Nuclear lysates were prepared from HCT116 cells before (−) or after (+) a 1-h treatment with 100 μM sodium arsenite. HuR-associated TRA2β4 mRNAs in nuclear lysates were isolated by HuR IP performed after RNase T1 digestion and were analyzed by RT-PCR. The results are representative of 3 independent experiments.
FIG 4
FIG 4
Involvement of the HuR-binding region in the arsenite-induced inclusion of TRA2β exon 2. (A) Endogenous HuR was silenced using siRNA targeting the 3′ UTR of HUR mRNA, and the MGTra-WT or MGTra-Δ39 minigene was transfected into HuR knockdown cells. Cells were then left untreated or were treated with 100 μM sodium arsenite for the indicated times. The inclusion of exon 2 and levels of transcripts containing exons 3 and 4 were analyzed by RT-PCR. (B) After treatment of HCT116 cells as explained for panel A, the percentages of exon 2 inclusion in transcripts from each MGTra minigene were measured by qPCR using transcripts containing exons 3 and 4 as a quantity control. (C) After treatment of HCT116 cells as explained for panel A, the amounts of transcripts derived from the indicated plasmids were analyzed as described in the legend to Fig. 2E. (D) MGTra-Δ39 was cotransfected with control siRNA or HuR siRNA for 48 h. Cells were then treated with 100 μM sodium arsenite in the presence of 2 μg/ml transcription inhibitor, actinomycin D. The amounts of transcripts derived from MGTra-Δ39 were analyzed as described in the legend to Fig. 2F.
FIG 5
FIG 5
Involvement of Chk2 and p38MAPK in arsenite-stimulated phosphorylation of HuR and alternative splicing of TRA2β pre-mRNA. (A) Subcellular distribution and phosphorylation states of HuR. Whole-cell, cytoplasmic, and nuclear fractions were prepared from HCT116 cells before (0) and 2, 4, or 6 h after exposure to 100 μM sodium arsenite. Amounts of HuR, α-tubulin (cytoplasmic marker), and hnRNPC1/C2 (nuclear marker) were measured by Western blotting. Levels of phosphorylated HuR were analyzed by Phos-tag SDS-PAGE, followed by Western blot analysis using an anti-HuR antibody. (B) Before (0) and 1 or 2 h after treatment of HCT116 cells with 100 μM sodium arsenite, the levels of Chk2, phosphorylated Chk2 at Thr68, p38MAPK, phosphorylated p38MAPK at Thr180/Tyr182, and HuR were measured by Western blotting, using GAPDH as a loading control. Levels of phosphorylated HuR were analyzed as described for panel A. (C) After transfection with 10 nM control siRNA, Chk2 siRNA, p38MAPK siRNA, or both Chk2 and p38MAPK siRNAs for 48 h, HCT116 cells were left untreated (0 h) or were treated (1 or 2 h) with 100 μM sodium arsenite. Levels of Chk2, p38MAPK, and HuR were measured by Western blotting, using GAPDH as a loading control. Levels of phosphorylated HuR were analyzed as described for panel A. (D) After transfection with 10 nM control siRNA or both Chk2 and p38MAPK siRNAs for 48 h, HCT116 cells were left untreated (0 h) or were treated (2 or 4 h) with 100 μM sodium arsenite, and cytoplasmic and nuclear fractions were prepared. HuR, α-tubulin, hnRNPC1/C2, and phosphorylated HuR levels were analyzed as described for panel A. (E) After treatment of HCT116 cells as described for panel C, the association between HuR and TRA2β4 mRNA was examined by RIP analysis and qPCR, using GAPDH mRNA as a quantity control. TRA2β4 mRNA levels enriched in HuR IP compared with those in IgG IP are shown as fold changes. Values are means ± SDs (n = 4). (F) HCT116 cells were transfected with 10 nM control or Chk2-plus-p38MAPK siRNA for 48 h and exposed to 100 μM sodium arsenite. RT-PCR was performed with primers specific for exons 1 and 4 or exons 3 and 4 as described in the legend to Fig. 1B. (G) HCT116 cells were transfected with 10 nM control, HuR, Chk2, p38MAPK, or Chk2-plus-p38MAPK siRNA for 48 h and exposed to 100 μM sodium arsenite. The levels of TRA2β1, TRA2β4, and TRA2β1-plus-TRA2β4 in these cells were measured by qPCR, using GAPDH mRNA as an endogenous control. Values are means ± SDs (n = 4). *, significantly different by analysis of variance and Tukey's multiple-comparison test (P < 0.05). (H) HCT116 cells were transfected with 10 nM control siRNA or both Chk2 and p38MAPK siRNAs for 48 h and exposed to 100 μM sodium arsenite for the indicated times. The levels of Tra2β were measured by Western blotting, using GAPDH as a loading control.
FIG 6
FIG 6
Involvement of Chk2 and p38MAPK in the arsenite-induced inclusion of TRA2β exon 2. (A) The MGTra-WT minigene was cotransfected with control siRNA or Chk2 and p38MAPK siRNAs for 48 h, and cells were treated with 100 μM sodium arsenite for the indicated times. Inclusion of exon 2 was analyzed by RT-PCR. (B) After treatment of HCT116 cells as described for panel A, the percentage of exon 2 inclusion in transcripts from each MGTra minigene was measured by qPCR using transcripts containing exons 3 and 4 as a quantity control. Values are means ± SDs (n = 5). (C) After treatment of HCT116 cells as described for panel A, the amounts of transcripts derived from the MGTra minigene were analyzed by qPCR, using GAPDH mRNA as an endogenous quantity control. Values are expressed as fold changes (means ± SDs, n = 5) compared with the respective values in untreated control cells.
FIG 7
FIG 7
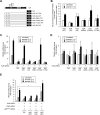
Effects of phosphorylation of HuR at S88, S100, or T118 on arsenite-stimulated binding to TRA2β4 mRNA and the expression of TRA2β4 mRNA. (A) Schematic diagram of plasmids encoding TAP, wild-type HuR (WT)-TAP, nonphosphorylatable mutant HuR (3A)-TAP (S88A, S100A, and T118A), HuR (S88A)-TAP, HuR (S100A)-TAP, HuR (T118A)-TAP, and phosphomimetic mutant HuR (3D)-TAP (S88D, S100D, and T118D). HNS, HuR nucleocytoplasmic shuttling sequence. (B) Endogenous HuR was silenced using siRNA targeting the HUR 3′ UTR, and TAP tag, HuR (WT)-TAP, HuR (3A)-TAP, HuR (3D)-TAP, HuR (S88A)-TAP, HuR (S100A)-TAP, or HuR (T118A)-TAP was overexpressed in these cells. Cells were then left untreated or treated with 100 μM sodium arsenite for 1 h. Data are expressed as the relative enrichment of TRA2β4 in chimeric HuR-expressing cells compared with the levels in TAP tag-transfected and HUR 3′ UTR siRNA-transfected cells. (C) Chimeric HuR (WT)-TAP, HuR (3A)-TAP, HuR (S88A)-TAP, HuR (S100A)-TAP, and HuR (T118A)-TAP proteins were overexpressed by transfection of the corresponding plasmids into endogenous-HuR-knockdown HCT116 cells. Before (untreated) and 1 or 2 h after treatment with 100 μM sodium arsenite, TRA2β4 mRNA levels were measured by qPCR, using GAPDH mRNA as an endogenous quantity control. Values are means ± SDs (n = 4). (D) After treatment of HCT116 cells as described for panel C, TRA2β1 mRNA levels were measured by qPCR, using GAPDH mRNA as an endogenous quantity control. Values are means ± SDs (n = 3). (E) Plasmids encoding TAP tag, HuR (WT)-TAP, HuR (3A)-TAP, or HuR (3D)-TAP were transfected into HCT116 cells in which endogenous HuR, Chk2, and p38MAPK were silenced. TRA2β4 mRNA levels in these cells were measured by qPCR before (untreated) and 1 or 2 h after treatment with 100 μM sodium arsenite. Values are expressed as fold changes (means ± SDs, n = 5) compared with the respective values in untreated control cells (0 h). *, significantly different from control value by Student's t test (P < 0.05).
FIG 8
FIG 8
Involvement of HuR, Chk2, and p38MAPK in alternative splicing of Tra2β-target mRNA. (A) HCT116 cells were transfected with 10 nM control siRNA (Ctrl), HuR siRNA (HuR), both Chk2 and p38MAPK siRNA (CP), or both HuR and TRA2β siRNAs (HT) for 48 h, and whole-cell lysates were prepared from these cells before (−) and 6 h after exposure to 100 μM sodium arsenite. The levels of HuR, Chk2, p38MAPK, and Tra2β were measured by Western blotting, using GAPDH as a loading control. (B) After treatment of HCT116 cells as described for panel A, transcript levels for isoforms that include TRA2β-targeted exons [indicated by (including)], those that exclude TRA2β-targeted exons [indicated by (excluding)], and total transcripts [indicated by (total)] of SMN1, SMN2, RIPK2, and TAU mRNAs were analyzed by RT-PCR. (C to F) After treatment of HCT116 cells as described for panel A, transcript levels for isoforms that include TRA2β-targeted exons (including), those that exclude TRA2β-targeted exons (excluding), and total transcripts (total) of SMN1 (C), SMN2 (D), RIPK2 (E), and TAU (F) mRNAs were measured by qPCR, using GAPDH mRNA as an endogenous quantity control. Primer sets are indicated in the diagrams.

Similar articles

Cited by

References

    1. Hinman MN, Lou H. 2008. Diverse molecular functions of Hu proteins. Cell. Mol. Life Sci. 65:3168–3181. 10.1007/s00018-008-8252-6 - DOI - PMC - PubMed
    1. Lopez de Silanes I, Zhan M, Lal A, Yang X, Gorospe M. 2004. Identification of a target RNA motif for RNA-binding protein HuR. Proc. Natl. Acad. Sci. U. S. A. 101:2987–2992. 10.1073/pnas.0306453101 - DOI - PMC - PubMed
    1. Abdelmohsen K, Kuwano Y, Kim HH, Gorospe M. 2008. Posttranscriptional gene regulation by RNA-binding proteins during oxidative stress: implications for cellular senescence. Biol. Chem. 389:243–255. 10.1515/BC.2008.022 - DOI - PMC - PubMed
    1. Abdelmohsen K, Pullmann R, Jr, Lal A, Kim HH, Galban S, Yang X, Blethrow JD, Walker M, Shubert J, Gillespie DA, Furneaux H, Gorospe M. 2007. Phosphorylation of HuR by Chk2 regulates SIRT1 expression. Mol. Cell 25:543–557. 10.1016/j.molcel.2007.01.011 - DOI - PMC - PubMed
    1. Abdelmohsen K, Lal A, Kim HH, Gorospe M. 2007. Posttranscriptional orchestration of an anti-apoptotic program by HuR. Cell Cycle 6:1288–1292. 10.4161/cc.6.11.4299 - DOI - PubMed

Publication types

MeSH terms

LinkOut - more resources