

Hepatic glucose uptake and disposition during short-term high-fat vs. high-fructose feeding
- PMID: 24865981
- PMCID: PMC4101635
- DOI: 10.1152/ajpendo.00083.2014
Hepatic glucose uptake and disposition during short-term high-fat vs. high-fructose feeding
Abstract
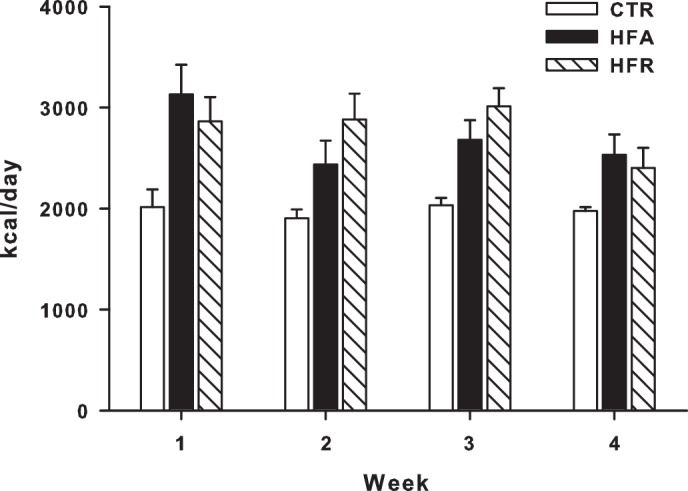
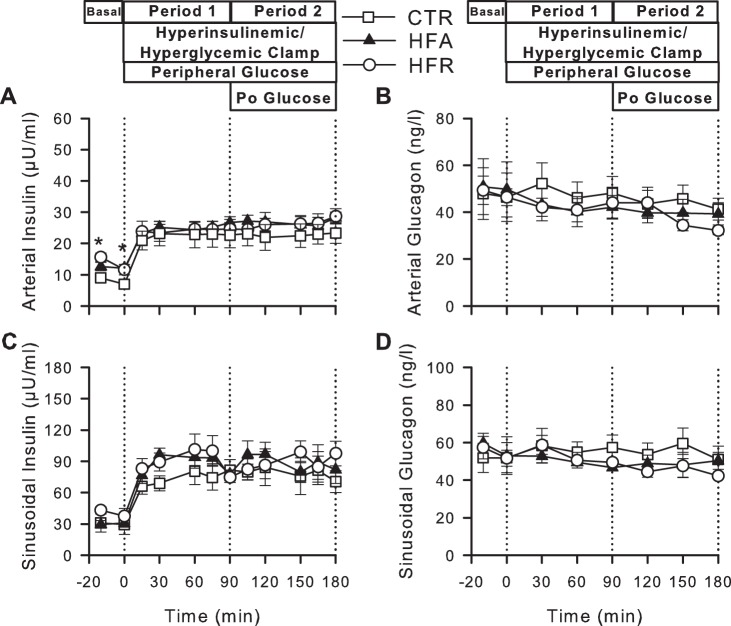
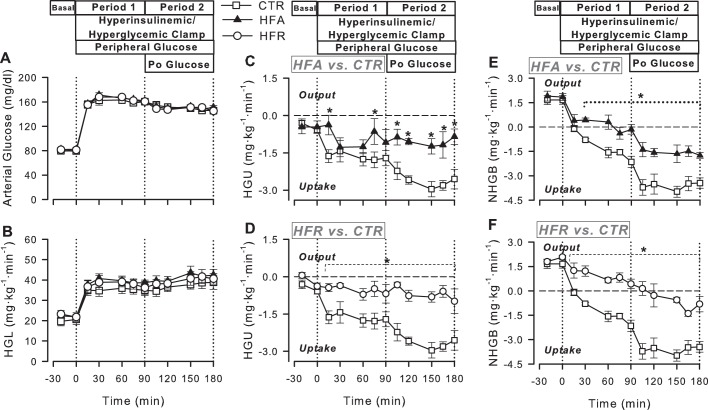
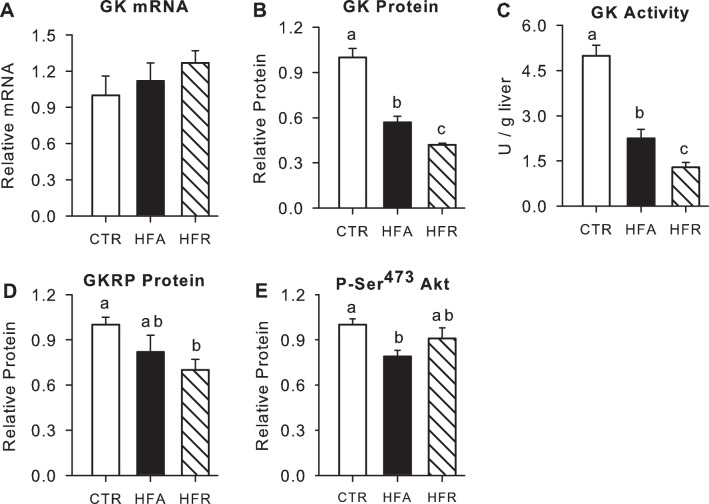
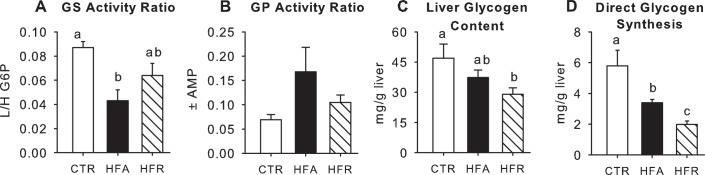
In dogs consuming a high-fat and -fructose diet (52 and 17% of total energy, respectively) for 4 wk, hepatic glucose uptake (HGU) in response to hyperinsulinemia, hyperglycemia, and portal glucose delivery is markedly blunted with reduction in glucokinase (GK) protein and glycogen synthase (GS) activity. The present study compared the impact of selective increases in dietary fat and fructose on liver glucose metabolism. Dogs consumed weight-maintaining chow (CTR) or hypercaloric high-fat (HFA) or high-fructose (HFR) diets diet for 4 wk before undergoing clamp studies with infusion of somatostatin and intraportal insulin (3-4 times basal) and glucagon (basal). The hepatic glucose load (HGL) was doubled during the clamp using peripheral vein (Pe) glucose infusion in the first 90 min (P1) and portal vein (4 mg·kg(-1)·min(-1)) plus Pe glucose infusion during the final 90 min (P2). During P2, HGU was 2.8 ± 0.2, 1.0 ± 0.2, and 0.8 ± 0.2 mg·kg(-1)·min(-1) in CTR, HFA, and HFR, respectively (P < 0.05 for HFA and HFR vs. CTR). Compared with CTR, hepatic GK protein and catalytic activity were reduced (P < 0.05) 35 and 56%, respectively, in HFA, and 53 and 74%, respectively, in HFR. Liver glycogen concentrations were 20 and 38% lower in HFA and HFR than CTR (P < 0.05). Hepatic Akt phosphorylation was decreased (P < 0.05) in HFA (21%) but not HFR. Thus, HFR impaired hepatic GK and glycogen more than HFA, whereas HFA reduced insulin signaling more than HFR. HFA and HFR effects were not additive, suggesting that they act via the same mechanism or their effects converge at a saturable step.
Keywords: Glucokinase; glycogen; glycogen phosphorylase; glycogen synthase; insulin signaling.
Copyright © 2014 the American Physiological Society.
Figures
Similar articles
-
Bromocriptine mesylate improves glucose tolerance and disposal in a high-fat-fed canine model.Am J Physiol Endocrinol Metab. 2020 Jul 1;319(1):E133-E145. doi: 10.1152/ajpendo.00479.2019. Epub 2020 May 27. Am J Physiol Endocrinol Metab. 2020. PMID: 32459527 Free PMC article.
-
Chronic overeating impairs hepatic glucose uptake and disposition.Am J Physiol Endocrinol Metab. 2015 May 15;308(10):E860-7. doi: 10.1152/ajpendo.00069.2015. Epub 2015 Mar 17. Am J Physiol Endocrinol Metab. 2015. PMID: 25783892 Free PMC article.
-
A high-fat, high-fructose diet accelerates nutrient absorption and impairs net hepatic glucose uptake in response to a mixed meal in partially pancreatectomized dogs.J Nutr. 2011 Sep;141(9):1643-51. doi: 10.3945/jn.111.145359. Epub 2011 Jul 20. J Nutr. 2011. PMID: 21775526 Free PMC article. Clinical Trial.
-
Small amounts of dietary fructose dramatically increase hepatic glucose uptake through a novel mechanism of glucokinase activation.Nutr Rev. 2002 Aug;60(8):253-7. doi: 10.1301/002966402320289377. Nutr Rev. 2002. PMID: 12199300 Review.
-
Effects of fructose on hepatic glucose metabolism.Curr Opin Clin Nutr Metab Care. 2003 Jul;6(4):441-8. doi: 10.1097/01.mco.0000078990.96795.cd. Curr Opin Clin Nutr Metab Care. 2003. PMID: 12806219 Review.
Cited by
-
Animal models of obesity and diabetes mellitus.Nat Rev Endocrinol. 2018 Mar;14(3):140-162. doi: 10.1038/nrendo.2017.161. Epub 2018 Jan 19. Nat Rev Endocrinol. 2018. PMID: 29348476 Review.
-
Bromocriptine mesylate improves glucose tolerance and disposal in a high-fat-fed canine model.Am J Physiol Endocrinol Metab. 2020 Jul 1;319(1):E133-E145. doi: 10.1152/ajpendo.00479.2019. Epub 2020 May 27. Am J Physiol Endocrinol Metab. 2020. PMID: 32459527 Free PMC article.
-
A computer model simulating human glucose absorption and metabolism in health and metabolic disease states.F1000Res. 2016 Apr 12;5:647. doi: 10.12688/f1000research.8299.1. eCollection 2016. F1000Res. 2016. PMID: 27347379 Free PMC article.
-
The Sweet Path to Metabolic Demise: Fructose and Lipid Synthesis.Trends Endocrinol Metab. 2016 Oct;27(10):719-730. doi: 10.1016/j.tem.2016.06.005. Epub 2016 Jul 4. Trends Endocrinol Metab. 2016. PMID: 27387598 Free PMC article. Review.
-
PEPCK1 Antisense Oligonucleotide Prevents Adiposity and Impairs Hepatic Glycogen Synthesis in High-Fat Male Fed Rats.Endocrinology. 2019 Jan 1;160(1):205-219. doi: 10.1210/en.2018-00630. Endocrinology. 2019. PMID: 30445425 Free PMC article.
References
-
- Adkins-Marshall BA, Myers SR, Hendrick GK, Williams PE, Triebwasser K, Floyd B, Cherrington AD. Interaction between insulin and glucose-delivery route in regulation of net hepatic glucose uptake in conscious dogs. Diabetes 39: 87–95, 1990 - PubMed
-
- Applied Research Program. Usual energy intake from total fat [Online]. Washington, DC: National Cancer Institute; http://appliedresearch.cancer.gov/diet/usualintakes/energy/t3.html [9 December 2013]
-
- Barzilai N, Rossetti L. Role of glucokinase and glucose-6-phosphatase in the acute and chronic regulation of hepatic glucose fluxes by insulin. J Biol Chem 268: 25019–25025, 1993 - PubMed
-
- Basu A, Basu R, Shah P, Vella A, Johnson CM, Nair KS, Jensen MD, Schwenk WF, Rizza RA. Effects of type 2 diabetes on the ability of insulin and glucose to regulate splanchnic and muscle glucose metabolism: evidence for a defect in hepatic glucokinase activity. Diabetes 49: 272–283, 2000 - PubMed
Publication types
MeSH terms
Substances
Grants and funding
LinkOut - more resources
Full Text Sources
Other Literature Sources
Medical
Miscellaneous