. 2014 Aug;34(8):1402-10.
doi: 10.1038/jcbfm.2014.97. Epub 2014 May 28.

Mapping brain glucose uptake with chemical exchange-sensitive spin-lock magnetic resonance imaging

Affiliations

Mapping brain glucose uptake with chemical exchange-sensitive spin-lock magnetic resonance imaging

Tao Jin et al. J Cereb Blood Flow Metab. 2014 Aug.

Abstract

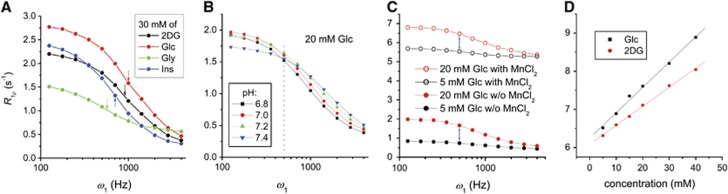
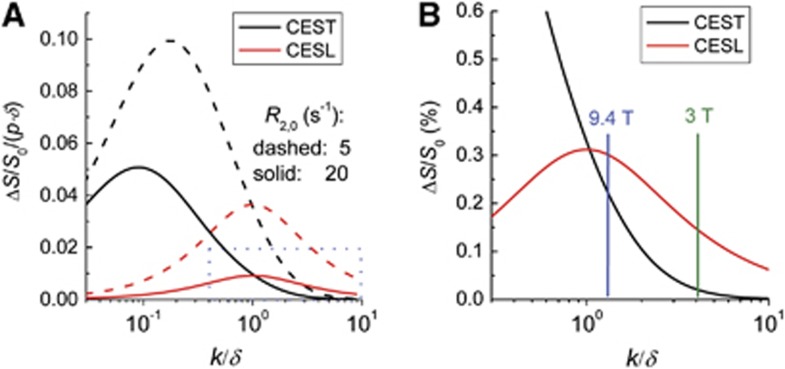
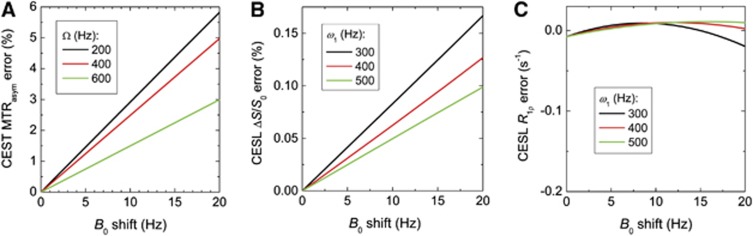
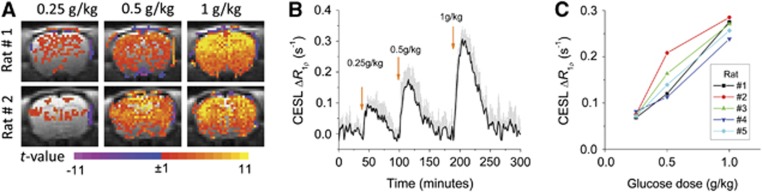
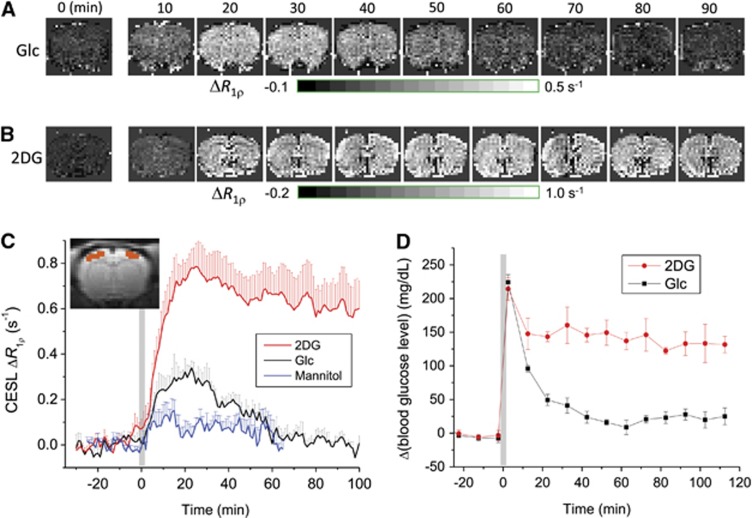
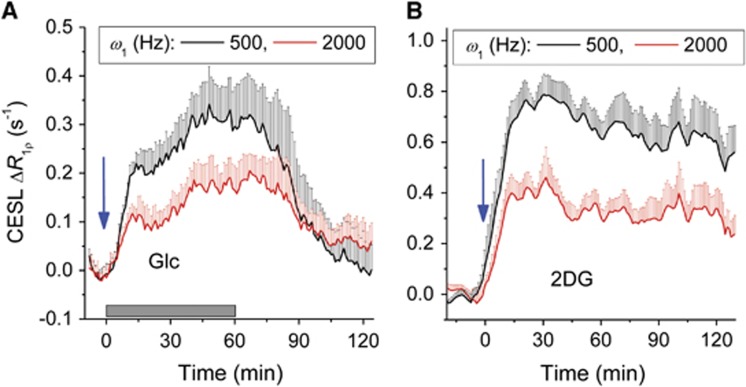
Uptake of administered D-glucose (Glc) or 2-deoxy-D-glucose (2DG) has been indirectly mapped through the chemical exchange (CE) between glucose hydroxyl and water protons using CE-dependent saturation transfer (glucoCEST) magnetic resonance imaging (MRI). We propose an alternative technique-on-resonance CE-sensitive spin-lock (CESL) MRI-to enhance responses to glucose changes. Phantom data and simulations suggest higher sensitivity for this 'glucoCESL' technique (versus glucoCEST) in the intermediate CE regime relevant to glucose. Simulations of CESL signals also show insensitivity to B0-fluctuations. Several findings are apparent from in vivo glucoCESL studies of rat brain at 9.4 Tesla with intravenous injections. First, dose-dependent responses are nearly linearly for 0.25-, 0.5-, and 1-g/kg Glc administration (obtained with 12-second temporal resolution), with changes robustly detected for all doses. Second, responses at a matched dose of 1 g/kg are much larger and persist for a longer duration for 2DG versus Glc administration, and are minimal for mannitol as an osmolality control. And third, with similar increases in steady-state blood glucose levels, glucoCESL responses are ∼2.2 times higher for 2DG versus Glc, consistent with their different metabolic properties. Overall, we show that glucoCESL MRI could be a highly sensitive and quantifiable tool for glucose transport and metabolism studies.


Figures

Figure 1
Figure 1
Chemical exchange-sensitive spin-lock magnetic resonance imaging data at 9.4 T (Tesla) from biochemical solutions prepared in phosphate-buffered saline, and measured at 37°C. (AC) Dispersion curves (rotating-frame spin-lattice relaxation rates, R, versus spin-lock frequencies, ω1) are displayed for solutions with (A) D-glucose (Glc), 2-deoxy-D-glucose (2DG), glycogen (Gly), and myo-inositol (Ins), all at 30 mmol/L concentration at pH=7.0; (B) 20 mmol/L Glc at four pH values; and (C) 5 and 20 mmol/L Glc at pH=7.0 without and with MnCl2. Color-matched arrows in panel A indicate the approximate half-width at half-maximum (HWHM) values of ω1 for each solution, suggesting that the chemical exchange rates (k) between protons in water and those in the hydroxyl groups are faster for Glc and 2DG versus Gly and Ins (see text for rationale). The dispersion curve in panel B is steepest for samples at pH=6.8 and 7.0, with HWHM values for ω1 increasing with pH value; the R values are similar for all pH values at ω1=500 Hz (vertical dashed line). The nearly identical R span between arrows at ω1=500 Hz in panel C indicates that Glc concentration-dependent R differences are independent of T1 and T2 relaxation. (D) As expected from Equation [2], R is shown to be linearly proportional to glucose concentration in Glc and 2DG solutions (at pH=7.0 with 0.15 mmol/L MnCl2; acquired with ω1=500 Hz); the slope of the linear fit is 0.066 per second per mmol/L for Glc and 0.050 per second per mmol/L for 2DG.
Figure 2
Figure 2
Simulations by Bloch–McConnell equations showing enhanced sensitivity to glucose detection for chemical exchange-sensitive spin lock (CESL) versus chemical exchange saturation transfer (CEST). Values shown are for the maximum contrast achievable. (A) Normalized contrast (ΔS/S0/(p·δ)) with CEST highest in the slow-exchange regimes (i.e., when k/(resonance frequency separation, δ) «1), where it outperforms CESL. Normalized contrast with CESL highest for intermediate-exchange regimes (k/δ ∼1), and CESL outperforms CEST in the fast-exchange regimes (k/δ>1). Contrast in both CEST and CESL depends on R2,0 (the transverse relaxation rate in the absence of exchange effects), but scales linearly with δ and with relative population (i.e., glucose hydroxyl protons to water protons, p) when p·δ<<1, so contrast is normalized by (p·δ). (B) Simulations are plotted over a smaller range of k/δ values, for reasonable in vivo values of R2,0=20 per second, 10 mmol/L of labile protons (P=0.00091), and δ=3,770 rad/second; vertical lines indicating the k/δ values appropriate for both D-glucose and 2-deoxy-D-glucose at 9.4 T (Tesla; blue line) and at 3 T (green line) show that CESL outperforms CEST at both field strengths; however, the sensitivity enhancement is substantially higher at 3 T.
Figure 3
Figure 3
Simulations by Bloch–McConnell equations showing that small magnetic field (B0) shifts give large errors in chemical exchange saturation transfer (CEST), and very small errors in chemical exchange-sensitive spin lock (CESL). Large B0-dependent errors appear for (A) CEST asymmetric magnetization transfer ratio (MTRasym) in simulations for three radiofrequency offset (Ω) values, while negligible B0-dependent errors are present for (B) CESL contrast (ΔS/S0), and (C) CESL R values in simulations at three ω1 levels. Note the vastly different vertical axes scales in panel A versus panel B.
Figure 4
Figure 4
Rat-brain glucoCESL studies at 9.4 T showing near-linear contrast for intravenously administered D-glucose (Glc) doses of 0.25, 0.5, and 1.0 g/kg, and robust detection for doses ⩾0.25 g/kg (in vivo paradigm 1). (A) The t-maps for each dose for two of the animals show highest t-values in the cortex where sensitivity is higher with our surface coil reception. Color scale: t-value. (B) Average of time courses for all animals (n=5, mean±s.e.m.) clearly shows the increase in brain ΔR with Glc dose. Arrows indicate time of injection. (C) The nearly linear dependence of peak brain ΔR on Glc dose appears for each individual animal. CESL, chemical exchange-sensitive spin lock.
Figure 5
Figure 5
Temporal dynamic properties in rat brain showing larger and longer-duration R responses at 9.4 T after the intravenous injection of 2-deoxy-D-glucose, 2DG (1 g/kg) versus D-glucose, Glc (1 g/kg)—with only minor contributions from osmolality changes (mannitol, 1 g/kg)—and more persistent elevation of blood glucose levels for 2DG versus Glc (in vivo paradigm 2). Representative time-resolved maps show ΔR before and 0 to 90 minutes after the injection of Glc (A) versus 2DG (B), where times are 0 to 10 and 80 to 90 minutes for the first and final postinjection maps, respectively; note the difference in ΔR gray scale ranges under each series. High-temporal resolution ΔR time courses (C) of Glc, 2DG, and mannitol (n=4 each, mean±s.e.m.) are shown for midcortical regions as typified by orange pixels in the inset image; time courses from all brain pixels are qualitatively similar to those of the midcortical regions (not shown). The hypertonic mannitol injection serves as an osmolality control to investigate contributions to ΔR owing to any changes in tissue water content. (D) Time courses of blood glucose changes in bench-top studies with injection of 1-g/kg Glc or 1-g/kg 2DG (n=3 each, mean±s.e.m.) show dynamic characteristics that differ from ΔR (compare to panel C) at initial time points (<20 minutes), but are similar at later time points; gray bar indicates injection time. CESL, chemical exchange-sensitive spin lock.
Figure 6
Figure 6
Rat-brain glucoCESL contrast at 9.4 T confirmed to be mainly from glucose chemical exchange (in vivo paradigm 3). Blood glucose concentrations were sustained at a steady state in (A) by injecting 0.3 g/kg D-glucose (Glc) over a 1-minute duration (blue arrow), followed by a constant infusion of Glc at 2 g/kg per hour for 1 hour (gray bar). For the 2-deoxy-D-glucose (2DG) studies of (B), a single injection of 1 g/kg was given at time=0. Arterial blood glucose levels at 60 minutes post injection increased to 160±25 mg/dL for Glc and 144±31 mg/dL for 2DG. Time courses of ΔR dependence on ω1 with intravenous injections of Glc (A, n=4, mean±s.e.m.) or 2DG (B, n=5, mean±s.e.m.) show values within midcortical regions, as typified in the inset image of Figure 5C. For clarity, ΔR data with ω1=1,000 Hz is not shown, since it falls between the data for ω1=500 and 2,000 Hz. The ΔR values are much smaller for ω1=2,000 versus 500 Hz, both for Glc and 2DG, which is expected for responses mainly due to CE effects. CESL, chemical exchange-sensitive spin lock.

References

    1. Choi I-Y, Lee S-P, Kim S-G, Gruetter R. In vivo measurements of brain glucose transport using the reversible Michaelis-Menton model and simultaneous measurements of cerebral blood flow changes during hyperglycemia. J Cereb Blood Flow Metab. 2001;21:653–663. - PubMed
    1. Choi IY, Lei HX, Gruetter R. Effect of deep pentobarbital anesthesia on neurotransmitter metabolism in vivo: on the correlation of total glucose consumption with glutamatergic action. J Cereb Blood Flow Metab. 2002;22:1343–1351. - PubMed
    1. Shestov AA, Emir UE, Kumar A, Henry PG, Seaquist ER, Oz G. Simultaneous measurement of glucose transport and utilization in the human brain. Am J Physiol Endocrinol Metab. 2011;301:E1040–E1049. - PMC - PubMed
    1. de Graaf RA, Pan JW, Telang F, Lee JH, Brown P, Novotny EJ, et al. Differentiation of glucose transport in human brain gray and white matter. J Cereb Blood Flow Metab. 2001;21:483–492. - PubMed
    1. Ward KM, Aletras AH, Balaban RS. A new class of contrast agents for MRI based on proton chemical exchange dependent saturation transfer (CEST) J Magn Reson. 2000;143:79–87. - PubMed

Publication types

MeSH terms