. 2014 Sep;13(9):2233-45.
doi: 10.1074/mcp.M113.037275. Epub 2014 May 27.

Rapid mapping of interactions between Human SNX-BAR proteins measured in vitro by AlphaScreen and single-molecule spectroscopy

Affiliations

Rapid mapping of interactions between Human SNX-BAR proteins measured in vitro by AlphaScreen and single-molecule spectroscopy

Emma Sierecki et al. Mol Cell Proteomics. 2014 Sep.

Abstract

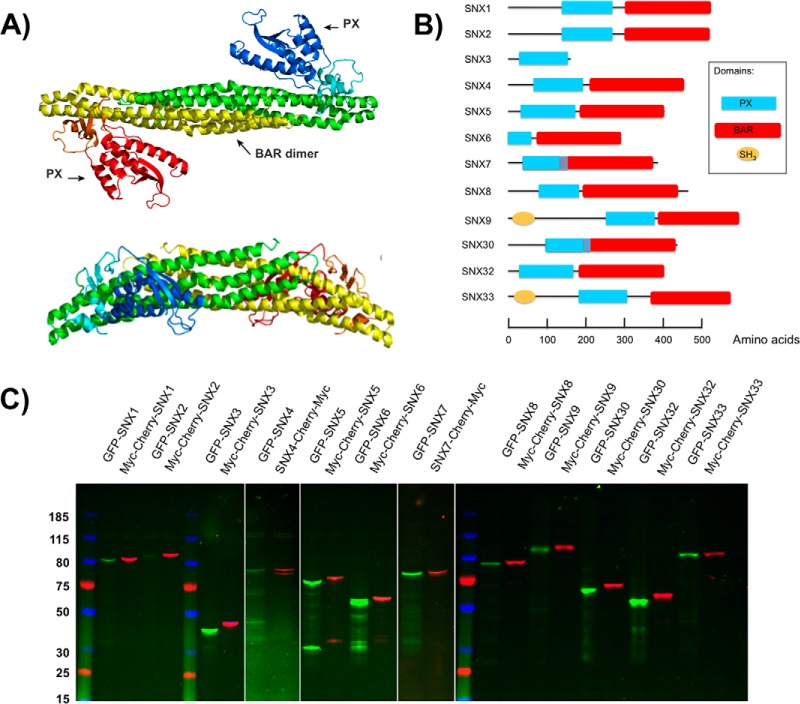
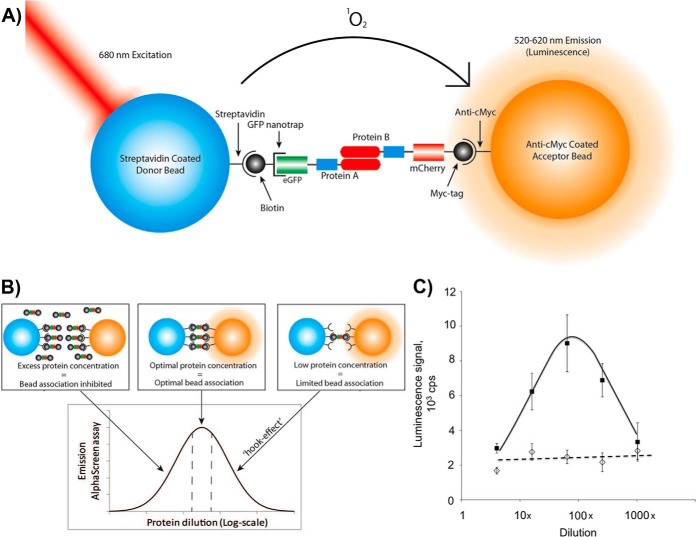
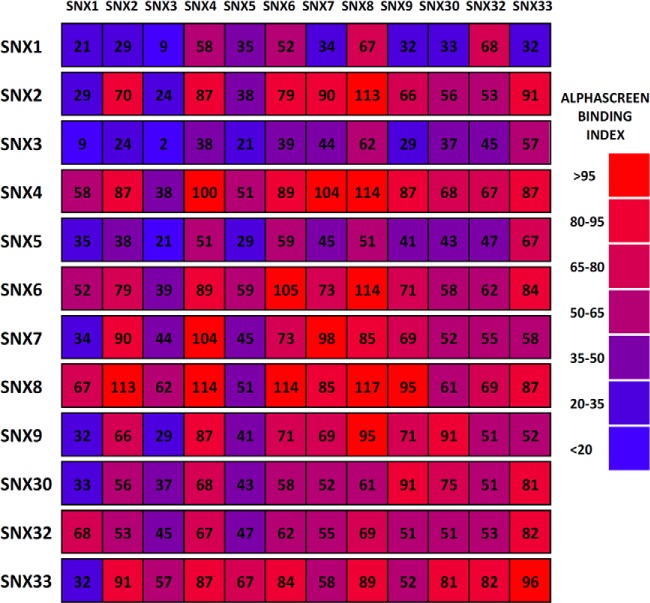
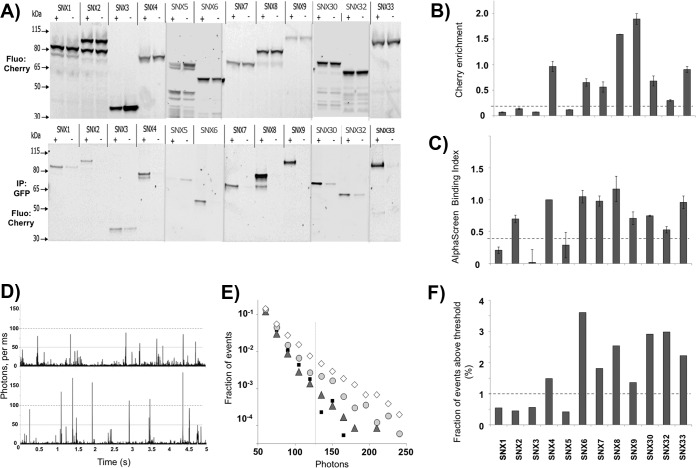
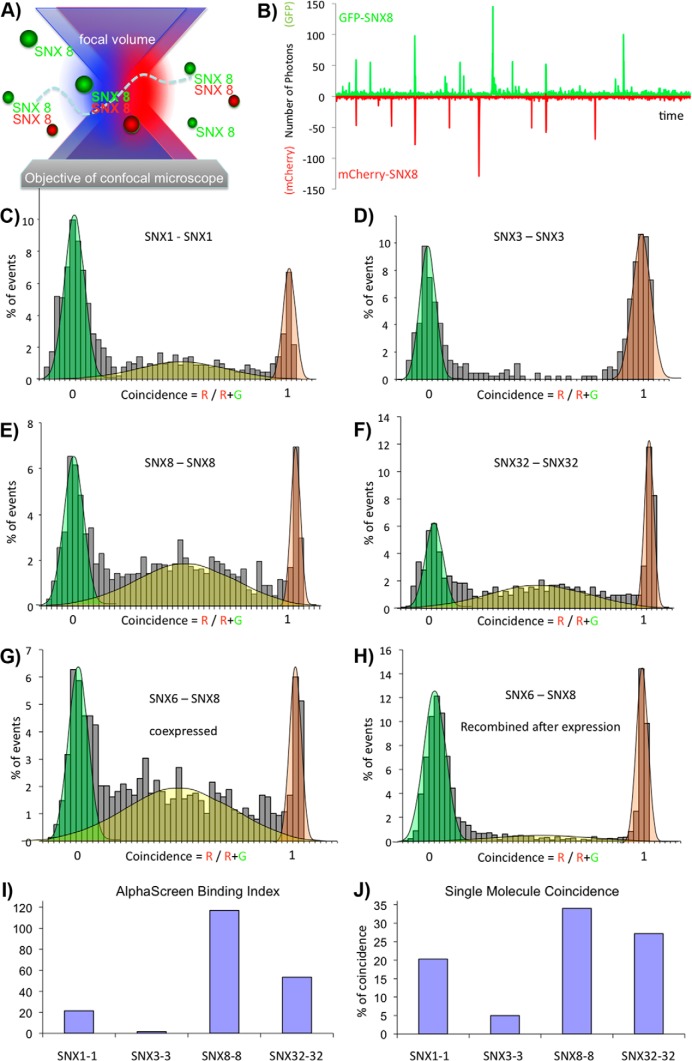
Protein dimerization and oligomerization is commonly used by nature to increase the structural and functional complexity of proteins. Regulated protein assembly is essential to transfer information in signaling, transcriptional, and membrane trafficking events. Here we show that a combination of cell-free protein expression, a proximity based interaction assay (AlphaScreen), and single-molecule fluorescence allow rapid mapping of homo- and hetero-oligomerization of proteins. We have applied this approach to the family of BAR domain-containing sorting nexin (SNX-BAR) proteins, which are essential regulators of membrane trafficking and remodeling in all eukaryotes. Dimerization of BAR domains is essential for creating a concave structure capable of sensing and inducing membrane curvature. We have systematically mapped 144 pairwise interactions between the human SNX-BAR proteins and generated an interaction matrix of preferred dimerization partners for each family member. We find that while nine SNX-BAR proteins are able to form homo-dimers, several including the retromer-associated SNX1, SNX2, and SNX5 require heteromeric interactions for dimerization. SNX2, SNX4, SNX6, and SNX8 show a promiscuous ability to bind other SNX-BAR proteins and we also observe a novel interaction with the SNX3 protein which lacks the BAR domain structure.


Figures

Fig. 1.
Fig. 1.
Expression of the human SNX-BAR proteins in L. tarentolae cell free lysate. A, Ribbon representation of a representative crystal structure of the SNX9 dimer (PDB:2RAI), viewed from the convex side (top) and the lateral side (bottom). One SNX9 subunit is shown in red/orange/yellow, the other in green/cyan/blue. Red/blue indicates the two PX (Phox) domains, orange/cyan the two yoke domains and yellow/green the two BAR (Bin, Amphiphysin, Rvs) domains. Dimerization of the BAR domains leads to a rigid banana-shaped structure. B, Domain structures of the 12 members of the sorting nexin (SNX) family analyzed here. All proteins possess a PX domain represented as a blue rectangle. Except for SNX3, all other proteins also contain a C-terminal BAR domain indicated in red. A Src Homology 3 (SH3) domain (orange circle) is also present in SNX9 and SNX33. C, SDS-Page analysis of the LTE expressed SNX-BAR domain proteins. Each protein was labeled with a N-terminal GFP tag or a Cherry-myc tag. Proteins were separated on SDS-PAGE gel (4–12% Tris-glycine) and visualized by in gel fluorescence scanning.
Fig. 2.
Fig. 2.
AlphaScreen assay for pair-wise interaction analysis. A, Schematic representation of AlphaScreen proximity assay. The streptavidin coated donor bead binds biotin coupled GFP-nanotrap that recruits N-terminally GFP-tagged protein A. The acceptor bead coated with anti-myc antibody binds to the C-terminal mCherry-myc tag of protein B. The donor bead contains phthalocyanine, a photosensitizer that converts ambient oxygen to an excited and reactive state upon illumination at 680 nm. The singlet oxygen (1O2) has a half-life of 4 μs in which it can diffuse ∼200 nm in solution. If an acceptor bead is within that distance, the singlet oxygen reacts with thioxene derivatives in the acceptor bead, subsequently luminescing at 520–620 nm. In the absence of an acceptor bead, the singlet oxygen will fall to ground state and no signal is produced. When protein A and B interact with each other, the proteins will bring the beads in a close proximity to each other, leading to the AlphaScreen signal. B, The “hooking effect” in the AlphaScreen assay. AlphaScreen signal measured in counts per seconds (cps) is dependent on the dilution of the protein. Low protein concentration in the assay will lead to a limited bead association and a low AlphaScreen signal. An excess of proteins will lead to a low AlphaScreen signal by inhibition of bead association through competition with the unbound proteins. C, Typical AlphaScreen data obtained for a noninteracting pair (GFP-SNX3 and SNX3-Cherry-myc, dotted line) and for an interacting pair (GFP-SNX8 and SNX8-Cherry-myc, black line). The proteins were co-expressed in LTE and diluted as indicated. The average signal ± S.E. for three different experiments is presented.
Fig. 3.
Fig. 3.
SNX-BAR interaction heat map measured by AlphaScreen. A binding index is calculated for each interaction over at least three experiments (see Experimental Procedures) and plotted in a color-coded matrix. Red indicates a strong interaction and blue corresponds to no detectable interaction.
Fig. 4.
Fig. 4.
Validation of SNX-BAR homo-dimerization by co-IP and fluorescence brightness analysis. A, In gel fluorescence detection of Cherry-labeled proteins before (top) and after (bottom) co-immunoprecipitation. C-terminal mCherry-myc labeled SNXs (preys) were co-expressed in LTE with N-terminal GFP labeled SNX (+) or GFP protein alone (−) as baits. GFP-labeled proteins were immunoprecipitated using GFP-nanotrap coated beads and loaded on SDS-PAGE gels (4%-12% acrylamide). Fluorescence scanning of the gel with excitation at 585/20 nm and detection at 620/20 nm is presented. B, Cherry fluorescence enrichment by co-immunoprecipitation. Fluorescence intensity on panel A was quantified and the ratio of intensities was calculated (r = Iafter CoIP/Ibefore CoIP). C, Related binding index from AlphaScreen assay. The binding index is calculated as described in the Experimental Procedures. The standard error (S.E.) over at least three experiments is represented. D, Representative fluorescence time-traces for single freely diffusing molecule brightness analysis. Burst intensity (photons counts per ms) are plotted as a function of time. The top panel (GFP-SNX3) corresponds to monomers diffusing through the confocal volume resulting in the maximal photon counts per ms of 50. The bottom panel (GFP-SNX8) shows bursts of 100 or more photons per ms, indicating the residence of two or more fluorophores in the confocal volume at the same time. This was interpreted as dimer formation. E, Burst intensity analysis for different SNXs. GFP-SNX fusion proteins, as well as a GFP-Cherry fusion protein, were expressed in LTE and diluted to 100 pm before analysis on a confocal microscope. Fluorescence signal was recorded for 500 s. The number of events for each intensity range was counted and normalized to the total number of events. This fraction of events P(I) is plotted as a function of burst intensity (I) (photons per ms) in a semi-logarithmic representation for GFP-Cherry (small black squares), SNX3 (grey triangles), SNX8 (light grey circles), and SNX6 (white diamonds). F, Brightness analysis. For each protein, the fraction of events above threshold (125 photons) was calculated.
Fig. 5.
Fig. 5.
Single molecule coincidence analysis of SNX-BAR domain proteins. A, Principle of single molecule coincidence analysis. In single molecule coincidence experiments, overlapped lasers (495 nm and 560 nm) are focused through a confocal microscope into a dilute sample. Fluorescent particles, labeled with GFP (green ball) or Cherry (red ball) diffuse freely in the solution. When a particle enters the observation volume, fluctuations of the signal (“burst”) are recorded either on the GFP channel (green) or the Cherry channel (red) B, Typical fluorescence time-trace (5 s) for an interacting protein pair (GFP-SNX8 and Cherry-SNX8). In some instances, a signal is simultaneously detected in both channels, indicating that a GFP and a Cherry fluorophore are present in the observation volume at the same time. This statistically only happens if two proteins (one GFP-labeled, the other Cherry-labeled) interact. C–H, Representative histograms for single molecule coincidence experiments. In experiments C–G, GFP-labeled proteins were co-expressed with Cherry-labeled proteins in LTE. In H, GFP-SNX8 and Cherry-SNX6 were expressed separately in LTE then mixed together and allowed to interact for 1h before the assay. In all cases, the mixtures were diluted to pm immediately before testing. A fluorescence signal was recorded in the GFP channel and the Cherry channel over 500s. The signal was then analyzed as a succession of individual events. For each event, a ratio of Cherry fluorescence to the total fluorescence is calculated. The number of events for each ratio C was counted and normalized to the total number of events. This fraction of events P(C) is plotted as a function of coincidence ratio (C). Gaussian curves are overlaid on the histograms: the green Gaussian curve corresponds to GFP only, the red Gaussian to Cherry only; the yellow Gaussian highlights the presence of both GFP and Cherry in the focal volume. Coincidence histograms are recorded for SNX1 (C), SNX3 (D), SNX8 (E), and SNX32 (F). Interactions of GFP-SNX8 with Cherry-SNX6, after co-expression (G) or mixing of separately expressed proteins (H) have been investigated. I, Binding index from AlphaScreen assay for SNX1-SNX1, SNX3-SNX3, SNX8-SNX8, and SNX32-SNX32 interactions. The binding index is calculated as described in the Experimental Procedures. J, Single molecule coincidence analysis for SNX1-SNX1, SNX3-SNX3, SNX8-SNX8, and SNX32-SNX32 interactions. The percentage of coincidence corresponds to the fraction of events with a coincidence ratio between 0.2 and 0.8.

Similar articles

Cited by

References

    1. Marianayagam N. J., Sunde M., Matthews J. M. (2004) The power of two: protein dimerization in biology. Trends Biochem. Sci. 29, 618–625 - PubMed
    1. Seet L. F., Hong W. (2006) The Phox (PX) domain proteins and membrane traffic. Biochim. Biophys. Acta 1761, 878–896 - PubMed
    1. Teasdale R. D., Collins B. M. (2012) Insights into the PX (phox-homology) domain and SNX (sorting nexin) protein families: structures, functions, and roles in disease. Biochem. J. 441, 39–59 - PubMed
    1. Cullen P. J. (2011) Phosphoinositides and the regulation of tubular-based endosomal sorting. Biochem. Soc. Trans. 39, 839–850 - PubMed
    1. van Weering J. R., Verkade P., Cullen P. J. (2010) SNX-BAR proteins in phosphoinositide-mediated, tubular-based endosomal sorting. Semin. Cell Dev. Biol. 21, 371–380 - PMC - PubMed

Publication types

Associated data