

Improving the quality of adult mortality data collected in demographic surveys: validation study of a new siblings' survival questionnaire in Niakhar, Senegal
- PMID: 24866715
- PMCID: PMC4035258
- DOI: 10.1371/journal.pmed.1001652
Improving the quality of adult mortality data collected in demographic surveys: validation study of a new siblings' survival questionnaire in Niakhar, Senegal
Abstract
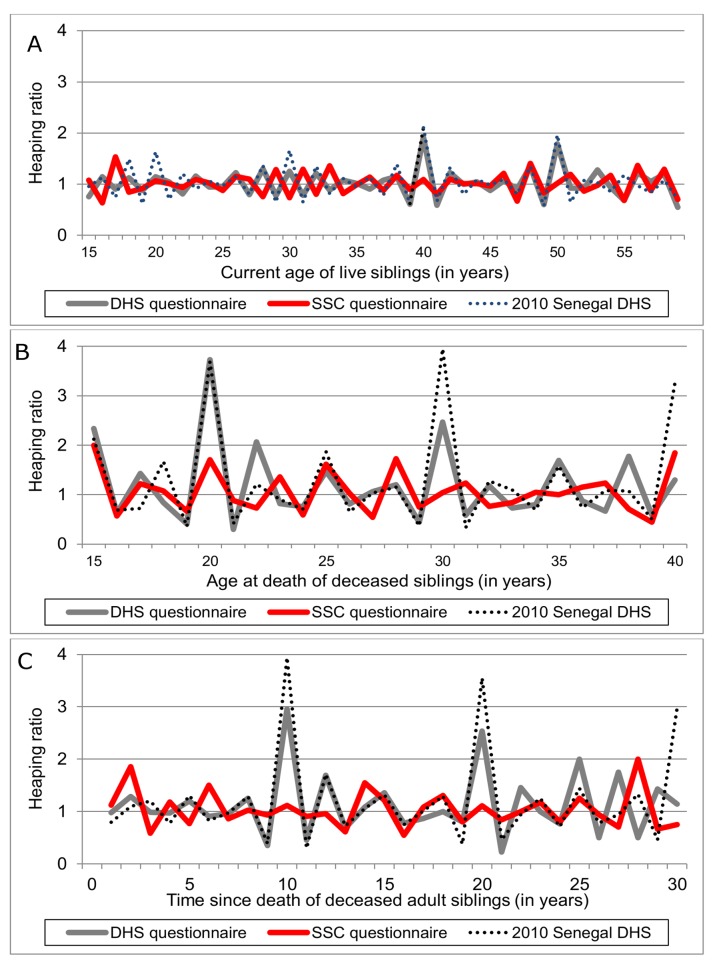
Background: In countries with limited vital registration, adult mortality is frequently estimated using siblings' survival histories (SSHs) collected during Demographic and Health Surveys (DHS). These data are affected by reporting errors. We developed a new SSH questionnaire, the siblings' survival calendar (SSC). It incorporates supplementary interviewing techniques to limit omissions of siblings and uses an event history calendar to improve reports of dates and ages. We hypothesized that the SSC would improve the quality of adult mortality data.
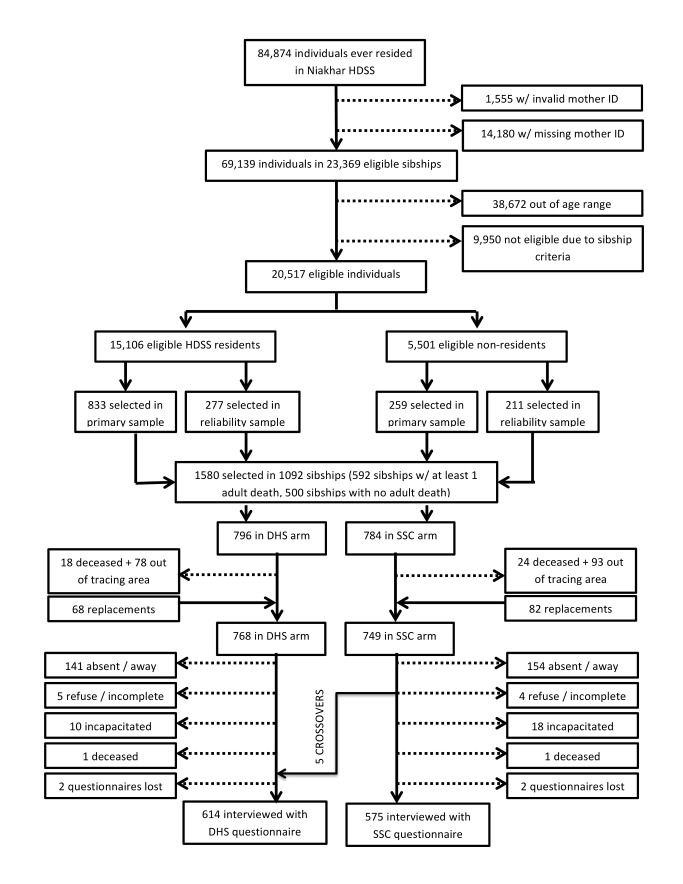
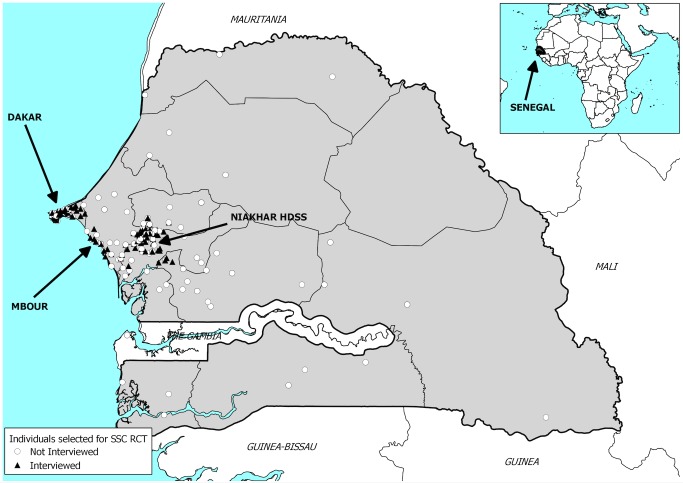
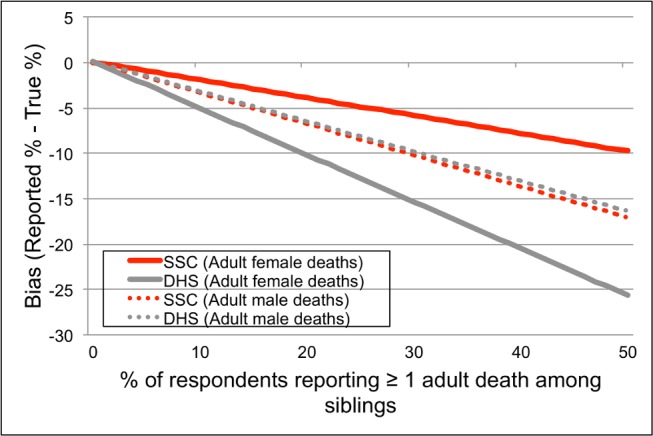
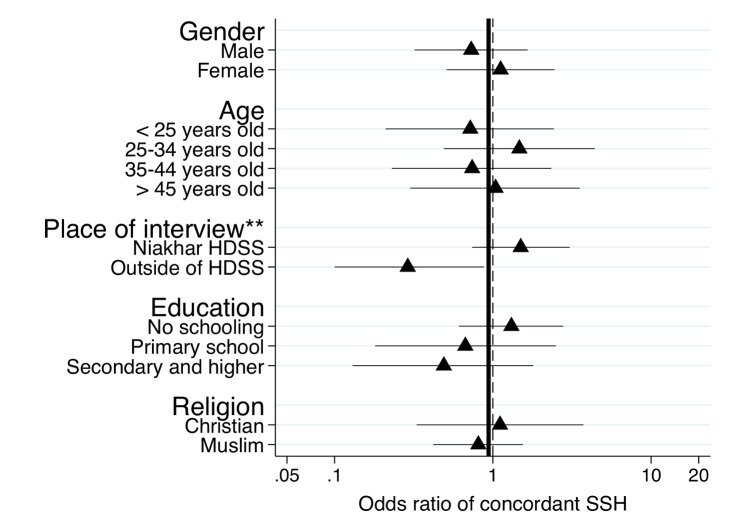
Methods and findings: We conducted a retrospective validation study among the population of the Niakhar Health and Demographic Surveillance System in Senegal. We randomly assigned men and women aged 15-59 y to an interview with either the DHS questionnaire or the SSC. We compared SSHs collected in each group to prospective data on adult mortality collected in Niakhar. The SSC reduced respondents' tendency to round reports of dates and ages to the nearest multiple of five or ten ("heaping"). The SSC also had higher sensitivity in recording adult female deaths: among respondents whose sister(s) had died at an adult age in the past 15 y, 89.6% reported an adult female death during SSC interviews versus 75.6% in DHS interviews (p = 0.027). The specificity of the SSC was similar to that of the DHS questionnaire, i.e., it did not increase the number of false reports of deaths. However, the SSC did not improve the reporting of adult deaths among the brothers of respondents. Study limitations include sample selectivity, limited external validity, and multiple testing.
Conclusions: The SSC has the potential to collect more accurate SSHs than the questionnaire used in DHS. Further research is needed to assess the effects of the SSC on estimates of adult mortality rates. Additional validation studies should be conducted in different social and epidemiological settings.
Trial registration: Controlled-Trials.com ISRCTN06849961
Conflict of interest statement
The authors have declared that no competing interests exist.
Figures
 indicated in Equation 2 (derived in [50]).
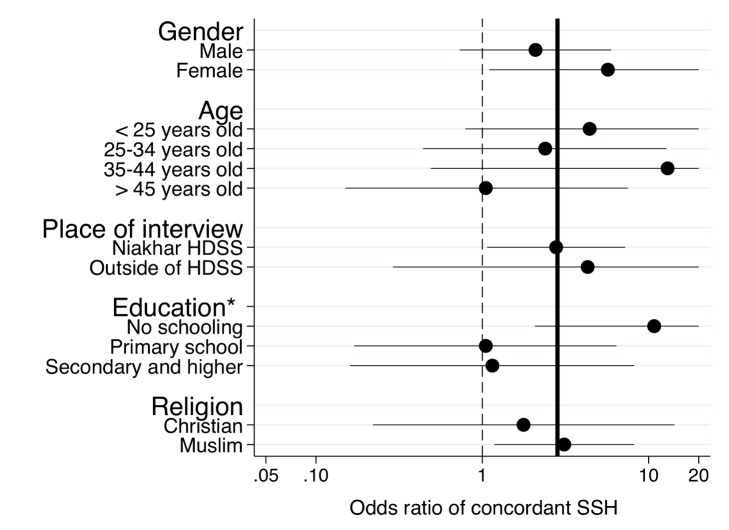
Similar articles
-
Improving survey data on pregnancy-related deaths in low-and middle-income countries: a validation study in Senegal.Trop Med Int Health. 2015 Nov;20(11):1415-1423. doi: 10.1111/tmi.12583. Epub 2015 Aug 28. Trop Med Int Health. 2015. PMID: 26250761
-
Errors in reported ages and dates in surveys of adult mortality: A record linkage study in Niakhar (Senegal).Popul Stud (Camb). 2021 Jul;75(2):269-287. doi: 10.1080/00324728.2020.1854332. Epub 2021 Jan 4. Popul Stud (Camb). 2021. PMID: 33390060 Free PMC article. Clinical Trial.
-
Reporting errors in siblings' survival histories and their impact on adult mortality estimates: results from a record linkage study in Senegal.Demography. 2014 Apr;51(2):387-411. doi: 10.1007/s13524-013-0268-3. Demography. 2014. PMID: 24493063 Free PMC article.
-
Impact of the HIV epidemic on mortality in sub-Saharan Africa: evidence from national surveys and censuses.AIDS. 1998;12 Suppl 1:S15-27. AIDS. 1998. PMID: 9677186 Review.
-
The impact of AIDS on adult mortality: evidence from national and regional statistics.AIDS. 2004 Jun;18 Suppl 2:S19-26. doi: 10.1097/00002030-200406002-00003. AIDS. 2004. PMID: 15319740 Review.
Cited by
-
Sibling mortality burden in low-income countries: A descriptive analysis of sibling death in Africa, Asia, and Latin America and the Caribbean.PLoS One. 2020 Oct 14;15(10):e0236498. doi: 10.1371/journal.pone.0236498. eCollection 2020. PLoS One. 2020. PMID: 33052952 Free PMC article.
-
A Novel Method for Verifying War Mortality while Estimating Iraqi Deaths for the Iran-Iraq War through Operation Desert Storm (1980-1993).PLoS One. 2016 Oct 21;11(10):e0164709. doi: 10.1371/journal.pone.0164709. eCollection 2016. PLoS One. 2016. PMID: 27768730 Free PMC article.
-
The Network Survival Method for Estimating Adult Mortality: Evidence From a Survey Experiment in Rwanda.Demography. 2017 Aug;54(4):1503-1528. doi: 10.1007/s13524-017-0594-y. Demography. 2017. PMID: 28741073 Free PMC article.
-
Improving retrospective data on recent household deaths: a multi-arm randomized trial in Guinea-Bissau.Int J Epidemiol. 2025 Feb 16;54(2):dyaf009. doi: 10.1093/ije/dyaf009. Int J Epidemiol. 2025. PMID: 39993265 Free PMC article. Clinical Trial.
-
Estimating Adult Death Rates From Sibling Histories: A Network Approach.Demography. 2021 Aug 1;58(4):1525-1546. doi: 10.1215/00703370-9368990. Demography. 2021. PMID: 34251434 Free PMC article.
References
-
- Hill K, Choi Y, Timaeus IM (2005) Unconventional approaches to mortality estimation. Demogr Res 13: 281–299.
-
- Hogan MC, Foreman KJ, Naghavi M, Ahn SY, Wang M, et al. (2010) Maternal mortality for 181 countries, 1980–2008: a systematic analysis of progress towards Millennium Development Goal 5. Lancet 375: 1609–1623. - PubMed
-
- Wang H, Dwyer-Lindgren L, Lofgren KT, Rajaratnam JK, Marcus JR, et al. (2013) Age-specific and sex-specific mortality in 187 countries, 1970-2010: a systematic analysis for the Global Burden of Disease Study 2010. Lancet 380: 2071–2094. - PubMed
-
- Masquelier B, Reniers G, Pison G (2013) Divergences in trends in child and adult mortality in sub-Saharan Africa: survey evidence on the survival of children and siblings. Popul Stud (Camb). E-pub ahead of print. doi:10.1080/00324728.2013.856458 - PubMed
-
- Rajaratnam JK, Marcus JR, Levin-Rector A, Chalupka AN, Wang H, et al. (2010) Worldwide mortality in men and women aged 15-59 years from 1970 to 2010: a systematic analysis. Lancet 375: 1704–1720. - PubMed
Publication types
MeSH terms
Associated data
Grants and funding
LinkOut - more resources
Full Text Sources
Other Literature Sources
Miscellaneous
