Newly defined landmarks for a three-dimensionally based cephalometric analysis: a retrospective cone-beam computed tomography scan review
- PMID: 24866835
- PMCID: PMC8634809
- DOI: 10.2319/021814-120.1
Newly defined landmarks for a three-dimensionally based cephalometric analysis: a retrospective cone-beam computed tomography scan review
Abstract
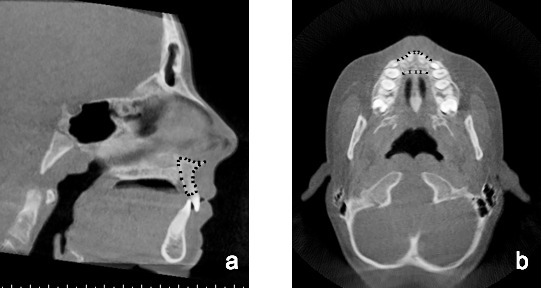
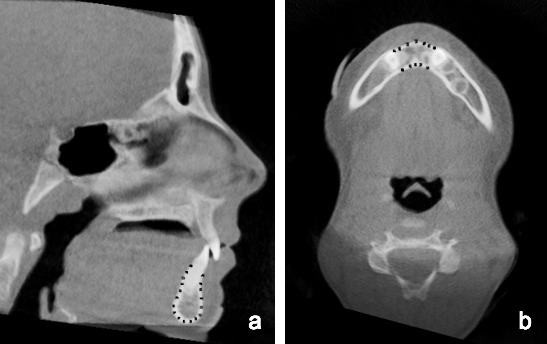
Objectives: To identify two novel three-dimensional (3D) cephalometric landmarks and create a novel three-dimensionally based anteroposterior skeletal measurement that can be compared with traditional two-dimensional (2D) cephalometric measurements in patients with Class I and Class II skeletal patterns.
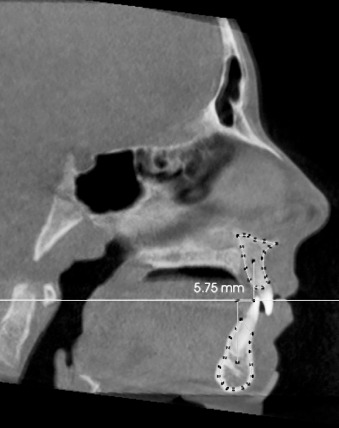
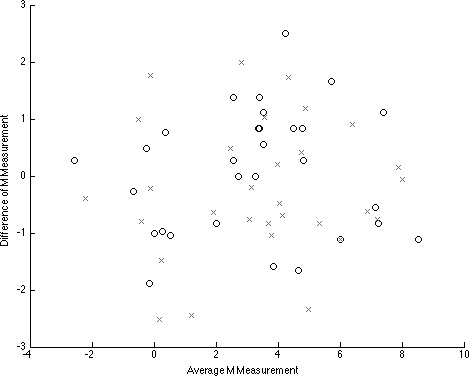
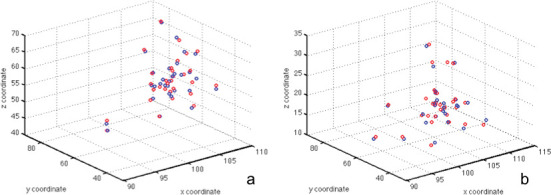
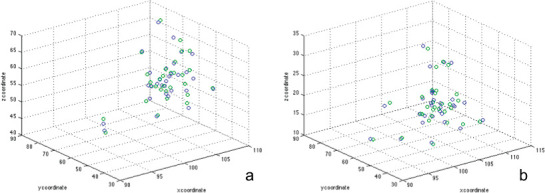
Materials and methods: Full head cone-beam computed tomography (CBCT) scans of 100 patients with all first molars in occlusion were obtained from a private practice. InvivoDental 3D (version 5.1.6, Anatomage, San Jose, Calif) was used to analyze the CBCT scans in the sagittal and axial planes to create new landmarks and a linear 3D analysis (M measurement) based on maxillary and mandibular centroids. Independent samples t-test was used to compare the mean M measurement to traditional 2D cephalometric measurements, ANB and APDI. Interexaminer and intraexaminer reliability were evaluated using 2D and 3D scatterplots.
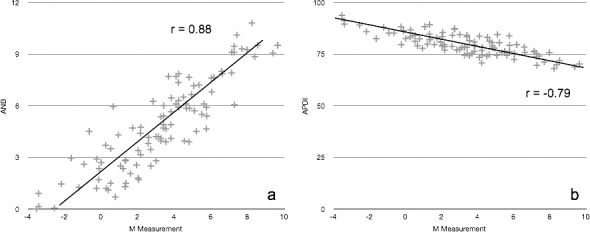
Results: The M measurement, ANB, and APDI could statistically differentiate between patients with Class I and Class II skeletal patterns (P < .001). The M measurement exhibited a correlation coefficient (r) of -0.79 and 0.88 with APDI and ANB, respectively.
Conclusions: The overall centroid landmarks and the M measurement combine 2D and 3D methods of imaging; the measurement itself can distinguish between patients with Class I and Class II skeletal patterns and can serve as a potential substitute for ANB and APDI. The new three-dimensionally based landmarks and measurements are reliable, and there is great potential for future use of 3D analyses for diagnosis and research.
Keywords: CBCT; Cephalometric analysis; Cephalometric landmarks.
Figures
Similar articles
-
Evaluation of masseter muscle morphology in different types of malocclusions using cone beam computed tomography.Int Orthod. 2014 Mar;12(1):32-48. doi: 10.1016/j.ortho.2013.12.003. Epub 2014 Jan 21. Int Orthod. 2014. PMID: 24456631 English, French.
-
The relationship between upper airways and craniofacial morphology studied in 3D. A CBCT study.Orthod Craniofac Res. 2015 Feb;18(1):1-11. doi: 10.1111/ocr.12053. Epub 2014 Sep 19. Orthod Craniofac Res. 2015. PMID: 25237711
-
Reliability of anatomic structures as landmarks in three-dimensional cephalometric analysis using CBCT.Angle Orthod. 2014 Sep;84(5):762-72. doi: 10.2319/090413-652.1. Epub 2013 Dec 23. Angle Orthod. 2014. PMID: 24364751 Free PMC article.
-
Reliability of different three-dimensional cephalometric landmarks in cone-beam computed tomography : A systematic review.Angle Orthod. 2019 Mar;89(2):317-332. doi: 10.2319/042018-302.1. Epub 2018 Nov 13. Angle Orthod. 2019. PMID: 30423256 Free PMC article.
-
Can artificial intelligence-driven cephalometric analysis replace manual tracing? A systematic review and meta-analysis.Eur J Orthod. 2024 Aug 1;46(4):cjae029. doi: 10.1093/ejo/cjae029. Eur J Orthod. 2024. PMID: 38895901 Free PMC article.
Cited by
-
Anterior cerebral falx plane in MR images to estimate the craniofacial midline.Sci Rep. 2023 Oct 1;13(1):16489. doi: 10.1038/s41598-023-42807-6. Sci Rep. 2023. PMID: 37779134 Free PMC article.
-
Craniofacial photographic superimposition: New developments.Forensic Sci Int Synerg. 2019 Oct 4;1:271-274. doi: 10.1016/j.fsisyn.2019.10.002. eCollection 2019. Forensic Sci Int Synerg. 2019. PMID: 32411979 Free PMC article. Review.
-
Skull Biomechanics and Simplified Cephalometric Lines for the Estimation of Muscular Lines of Action.J Pers Med. 2023 Nov 1;13(11):1569. doi: 10.3390/jpm13111569. J Pers Med. 2023. PMID: 38003884 Free PMC article.
-
A knowledge-based algorithm for automatic detection of cephalometric landmarks on CBCT images.Int J Comput Assist Radiol Surg. 2015 Nov;10(11):1737-52. doi: 10.1007/s11548-015-1173-6. Epub 2015 Apr 7. Int J Comput Assist Radiol Surg. 2015. PMID: 25847662
-
Computerized three-dimensional cephalometric template for Thai adults.Heliyon. 2023 Apr 1;9(4):e15077. doi: 10.1016/j.heliyon.2023.e15077. eCollection 2023 Apr. Heliyon. 2023. PMID: 37095961 Free PMC article.
References
-
- Broadbent BH. A new x-ray technique and its application to orthodontia: the introduction of cephalometric radiography. Angle Orthod. 1981;51:93–114.
-
- Baumrind S, Frantz RC. The reliability of head film measurements. 1. Landmark identification. Am J Orthod. 1971;60:111–127. - PubMed
-
- Baumrind S, Frantz RC. The reliability of head film measurements. 2. Conventional angular and linear measures. Am J Orthod. 1971;60:505–517. - PubMed
-
- Halazonetis DJ. Cone-beam computed tomography is not the imaging technique of choice for comprehensive orthodontic assessment. Am J Orthod Dentofacial Orthop. 2012;141:403–405–407. - PubMed
Publication types
MeSH terms
LinkOut - more resources
Full Text Sources