

Development, calibration and performance of an HIV transmission model incorporating natural history and behavioral patterns: application in South Africa
- PMID: 24867402
- PMCID: PMC4035281
- DOI: 10.1371/journal.pone.0098272
Development, calibration and performance of an HIV transmission model incorporating natural history and behavioral patterns: application in South Africa
Abstract
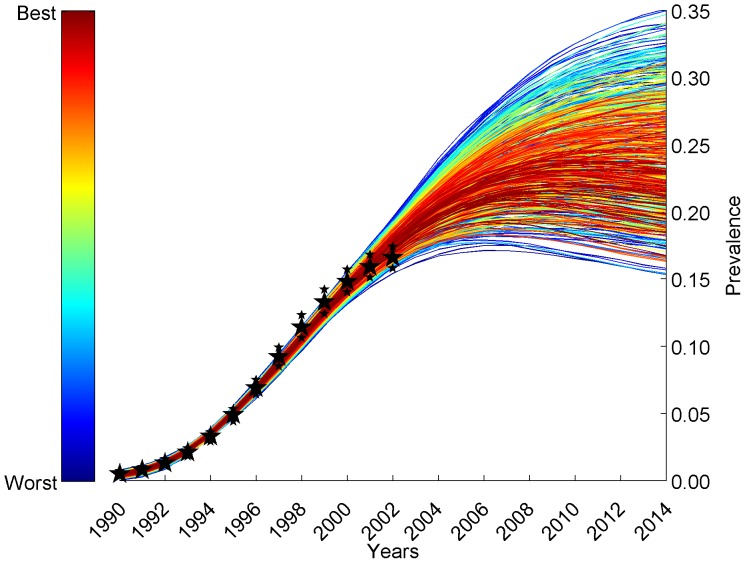
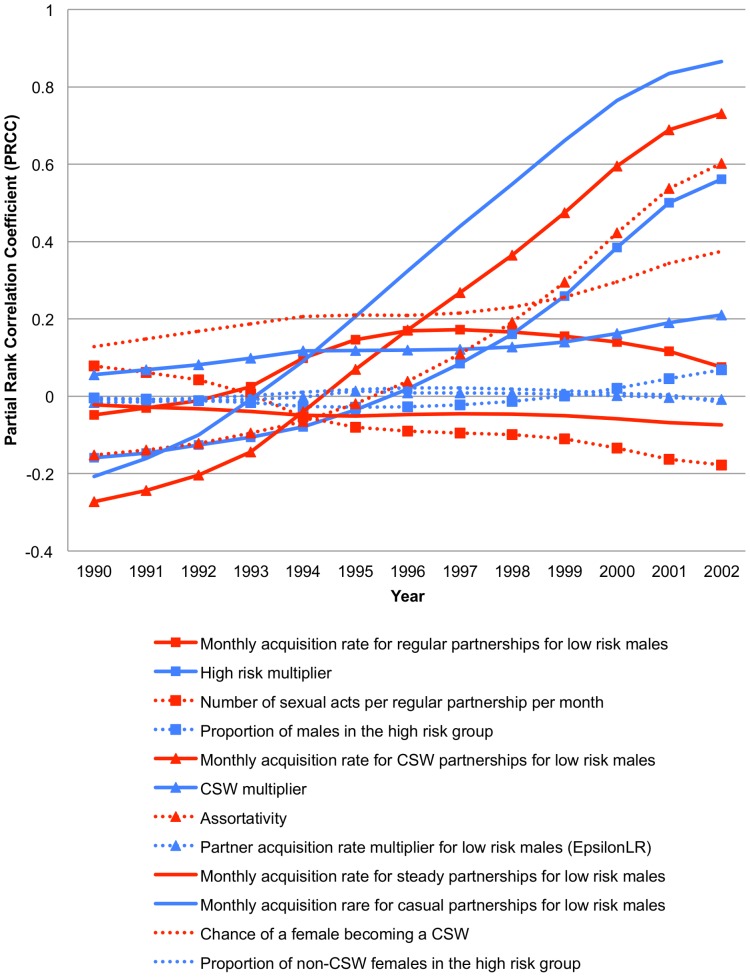
Understanding HIV transmission dynamics is critical to estimating the potential population-wide impact of HIV prevention and treatment interventions. We developed an individual-based simulation model of the heterosexual HIV epidemic in South Africa and linked it to the previously published Cost-Effectiveness of Preventing AIDS Complications (CEPAC) International Model, which simulates the natural history and treatment of HIV. In this new model, the CEPAC Dynamic Model (CDM), the probability of HIV transmission per sexual encounter between short-term, long-term and commercial sex worker partners depends upon the HIV RNA and disease stage of the infected partner, condom use, and the circumcision status of the uninfected male partner. We included behavioral, demographic and biological values in the CDM and calibrated to HIV prevalence in South Africa pre-antiretroviral therapy. Using a multi-step fitting procedure based on Bayesian melding methodology, we performed 264,225 simulations of the HIV epidemic in South Africa and identified 3,750 parameter sets that created an epidemic and had behavioral characteristics representative of a South African population pre-ART. Of these parameter sets, 564 contributed 90% of the likelihood weight to the fit, and closely reproduced the UNAIDS HIV prevalence curve in South Africa from 1990-2002. The calibration was sensitive to changes in the rate of formation of short-duration partnerships and to the partnership acquisition rate among high-risk individuals, both of which impacted concurrency. Runs that closely fit to historical HIV prevalence reflect diverse ranges for individual parameter values and predict a wide range of possible steady-state prevalence in the absence of interventions, illustrating the value of the calibration procedure and utility of the model for evaluating interventions. This model, which includes detailed behavioral patterns and HIV natural history, closely fits HIV prevalence estimates.
Conflict of interest statement
Figures


Similar articles
-
Plausible and implausible parameters for mathematical modeling of nominal heterosexual HIV transmission.Ann Epidemiol. 2007 Mar;17(3):237-44. doi: 10.1016/j.annepidem.2006.10.011. Ann Epidemiol. 2007. PMID: 17320790
-
HIV seroconcordance among heterosexual couples in rural KwaZulu-Natal, South Africa: a population-based analysis.J Int AIDS Soc. 2020 Jan;23(1):e25432. doi: 10.1002/jia2.25432. J Int AIDS Soc. 2020. PMID: 31916420 Free PMC article.
-
Effectiveness of combination packages for HIV-1 prevention in sub-Saharan Africa depends on partnership network structure: a mathematical modelling study.Sex Transm Infect. 2016 Dec;92(8):619-624. doi: 10.1136/sextrans-2015-052476. Epub 2016 Jun 9. Sex Transm Infect. 2016. PMID: 27288415 Free PMC article.
-
AIDS in rural Africa: a paradigm for HIV-1 prevention.Int J STD AIDS. 1996 Jul;7(4):236-43. doi: 10.1258/0956462961917906. Int J STD AIDS. 1996. PMID: 8876353 Review.
-
AIDS in sub-Saharan Africa: the epidemiology of heterosexual transmission and the prospects for prevention.Epidemiology. 1993 Jan;4(1):63-72. Epidemiology. 1993. PMID: 8420583 Review.
Cited by
-
Agent-based evolving network modeling: a new simulation method for modeling low prevalence infectious diseases.Health Care Manag Sci. 2021 Sep;24(3):623-639. doi: 10.1007/s10729-021-09558-0. Epub 2021 May 15. Health Care Manag Sci. 2021. PMID: 33991293 Free PMC article.
-
"We've Got Our Own Beliefs, Attitudes, Myths": A Mixed Methods Assessment of Rural South African Health Care Workers' Knowledge of and Attitudes Towards PrEP Implementation.AIDS Behav. 2021 Aug;25(8):2517-2532. doi: 10.1007/s10461-021-03213-z. Epub 2021 Mar 24. AIDS Behav. 2021. PMID: 33763802 Free PMC article.
-
Bayesian inference of a non-local proliferation model.R Soc Open Sci. 2021 Nov 24;8(11):211279. doi: 10.1098/rsos.211279. eCollection 2021 Nov. R Soc Open Sci. 2021. PMID: 34849247 Free PMC article.
-
Comparative Effectiveness of Interventions to Improve the HIV Continuum of Care and HIV Preexposure Prophylaxis in Kenya: A Model-Based Analysis.J Infect Dis. 2022 Mar 15;225(6):1032-1039. doi: 10.1093/infdis/jiaa633. J Infect Dis. 2022. PMID: 33106850 Free PMC article.
-
Modelling the epidemiologic impact of achieving UNAIDS fast-track 90-90-90 and 95-95-95 targets in South Africa.Epidemiol Infect. 2019 Jan;147:e122. doi: 10.1017/S0950268818003497. Epidemiol Infect. 2019. PMID: 30869008 Free PMC article.
References
-
- UNAIDS (2012) AIDSinfo Online Database - South Africa.
-
- UNAIDS/WHO (2009) AIDS Epidemic Update: November 2009. Geneva: UNAIDS.
Publication types
MeSH terms
Grants and funding
LinkOut - more resources
Full Text Sources
Other Literature Sources
Medical
Miscellaneous
