. 2014 Jul 8;111(1):85-93.
doi: 10.1038/bjc.2014.272. Epub 2014 May 27.

Profiling and targeting of cellular bioenergetics: inhibition of pancreatic cancer cell proliferation

Affiliations

Profiling and targeting of cellular bioenergetics: inhibition of pancreatic cancer cell proliferation

G Cheng et al. Br J Cancer. .

Abstract

Background: Targeting both mitochondrial bioenergetics and glycolysis pathway is an effective way to inhibit proliferation of tumour cells, including those that are resistant to conventional chemotherapeutics.

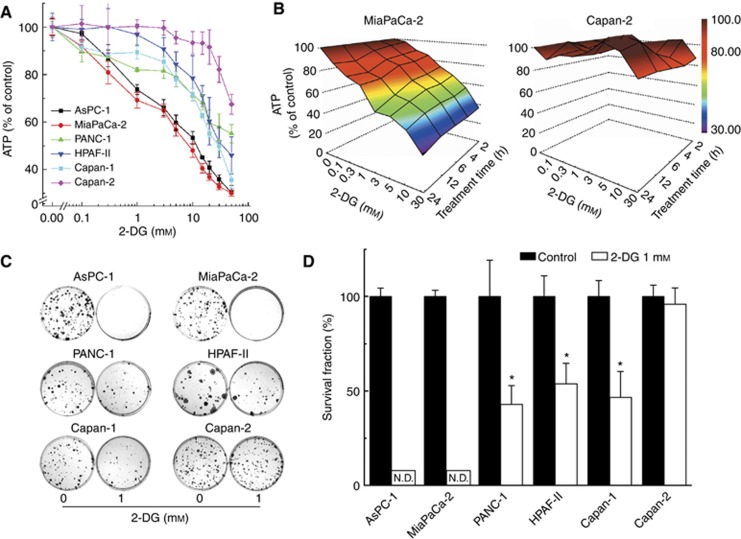
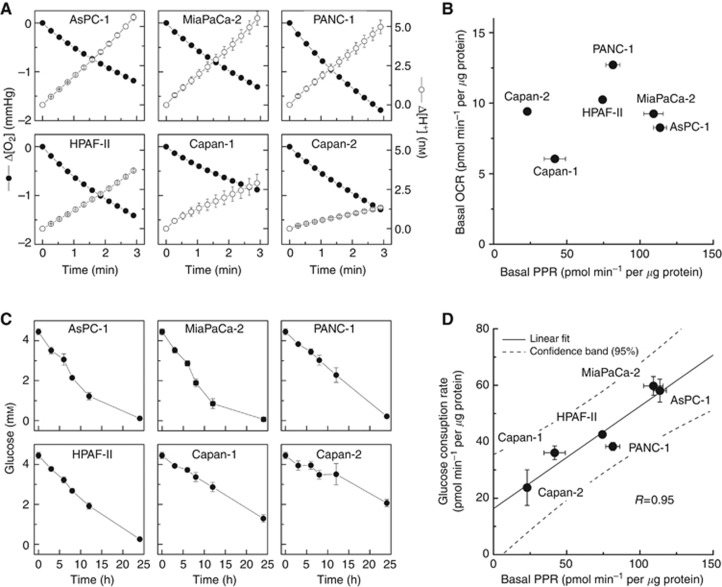
Methods: In this study, using the Seahorse 96-well Extracellular Flux Analyzer, we mapped the two intrinsic cellular bioenergetic parameters, oxygen consumption rate and proton production rate in six different pancreatic cancer cell lines and determined their differential sensitivity to mitochondrial and glycolytic inhibitors.

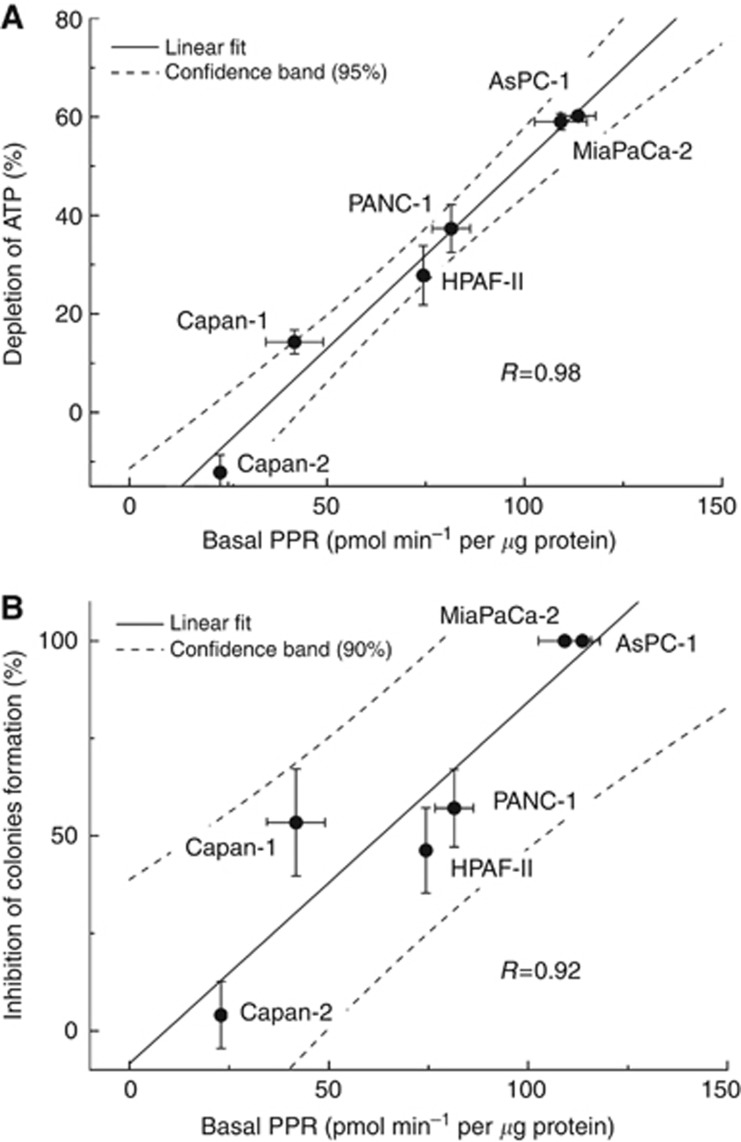
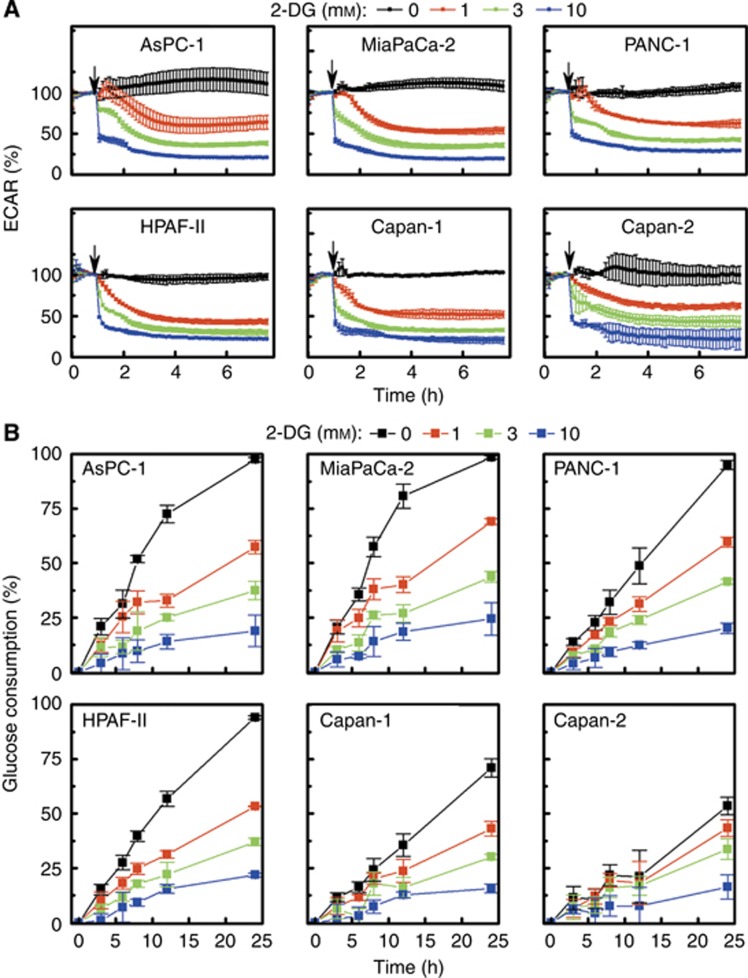
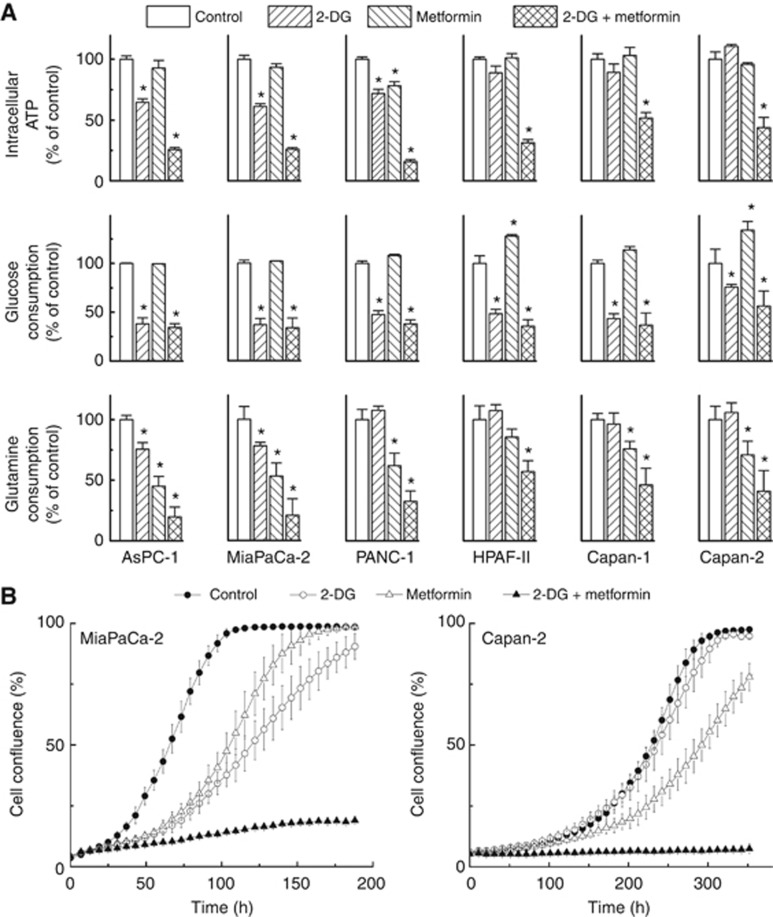
Results: There exists a very close relationship among intracellular bioenergetic parameters, depletion of ATP and anti-proliferative effects (inhibition of colony-forming ability) in pancreatic cancer cells derived from different genetic backgrounds treated with the glycolytic inhibitor, 2-deoxyglucose (2-DG). The most glycolytic pancreatic cancer cell line was exquisitely sensitive to 2-DG, whereas the least glycolytic pancreatic cancer cell was resistant to 2-DG. However, when combined with metformin, inhibitor of mitochondrial respiration and activator of AMP-activated protein kinase, 2-DG synergistically enhanced ATP depletion and inhibited cell proliferation even in poorly glycolytic, 2-DG-resistant pancreatic cancer cell line. Furthermore, treatment with conventional chemotherapeutic drugs (e.g., gemcitabine and doxorubicin) or COX-2 inhibitor, celecoxib, sensitised the cells to 2-DG treatment.

Conclusions: Detailed profiling of cellular bioenergetics can provide new insight into the design of therapeutic strategies for inhibiting pancreatic cancer cell metabolism and proliferation.


Figures

Figure 1
Figure 1
Susceptibility of pancreatic cancer cells to 2-DG. (A) Six pancreatic cancer cells were treated with 2-DG (0.1–50 mM) for 6 h and intracellular ATP levels were measured using a luciferase-based assay. Data are shown as a percentage of control (non-treated) cells after normalisation to total cellular protein in each well. (B) A three-dimensional representation showing the concentration and time-dependent effects of 2-DG on intracellular ATP levels in MiaPaCa-2 cells (left) and in Capan-2 cells (right). (C) The effect of 2-DG on colony formation in pancreatic cancer cells treated with 2-DG (1 mM). (D) The survival fractions of six pancreatic cancer cell lines after treatment with 2-DG. ND=colonies not detected.
Figure 2
Figure 2
Profiling of bioenergetics of pancreatic cancer cells. (A) Oxygen consumption (ΔO2) and proton production (ΔH+) traces in six pancreatic cancer cell lines as monitored with a Seahorse XF96 Analyzer, as described in Materials and Methods section. The changes in O2 and H+ concentrations were normalised to 1 μg of cellular protein. (B) Two-dimensional map of oxygen consumption rate (OCR) and proton production rate (PPR) measured in six pancreatic cancer cell lines. (C) Changes in glucose concentration in media incubated with six pancreatic cancer cell lines. (D) Relationship between the basal PPR values and glucose consumption rates. The glucose consumption rate (0–12 h, calculated from (C) is plotted against the basal PPR value of each cell line. Values are mean±s.d. (n=4–6).
Figure 3
Figure 3
Relationship between ATP depletion, inhibition of colony formation and basal PPR values of pancreatic cancer cells in response to 2-DG treatment. (A) Pancreatic cancer cells were treated with 2-DG (3 mM) for 24 h and the extent of ATP depletion was plotted against the PPR values. Negative value for Capan-2 corresponds to a small increase in ATP level after treatment with 2-DG. (B) Graph showing the relationship between the extent of inhibition of colony formation by 2-DG (1 mM) and determined basal PPR values for each cell line.
Figure 4
Figure 4
Real-time monitoring of changes in ECAR and glucose consumption in pancreatic cancer cells treated with 2-DG. (A) Pancreatic cancer cells were treated with different concentrations of 2-DG and the ECAR values measured with a Seahorse XF96 Flux Analyzer. The arrows indicate the time point of 2-DG injection. The ECAR value recorded immediately before injection of 2-DG is 100%. (B) The kinetics of glucose consumption by pancreatic cells at different concentrations of 2-DG. The glucose levels in the media were measured in response to 2-DG treatment under conditions similar to those of (A) and presented as the amount consumed in relation to the initial level in the medium.
Figure 5
Figure 5
Synergistic depletion of ATP and inhibition of cell proliferation by 2-DG and metformin. (A) Pancreatic cancer cells were treated with 2-DG (3 mM) or metformin (10 mM) independently and together for 24 h and intracellular ATP levels (top), glucose consumption (middle), and glutamine consumption (bottom) were determined, normalised to total cellular protein amount and expressed as percentage of untreated cells. Data shown represent the mean±s.d. *P<0.05, (n=4) vs control in each cell line. (B) Effects of 2-DG and metformin alone and together, on cell proliferation. MiaPaCa-2 and Capan-2 cells were treated with 2-DG (0.5 mM in MiaPaCa-2, 1 mM in Capan-2 cells) or metformin (1 mM) alone and together. Cell proliferation was monitored in real time with the continuous presence of indicated treatments until the end of each experiment. The changes in cell confluence are used as a surrogate marker of cell proliferation. Data shown are the mean±s.d. (n=6).

References

    1. American Cancer Society . Cancer Facts & Figures 2013. American Cancer Society: Atlanta, GA, USA; 2013. pp. 25–34.
    1. Ben Sahra I, Laurent K, Giuliano S, Larbret F, Ponzio G, Gounon P, Le Marchand-Brustel Y, Giorgetti-Peraldi S, Cormont M, Bertolotto C, Deckert M, Auberger P, Tanti JF, Bost F. Targeting cancer cell metabolism: the combination of metformin and 2-deoxyglucose induces p53-dependent apoptosis in prostate cancer cells. Cancer Res. 2010;70:2465–2475. - PubMed
    1. Bernal SD, Lampidis TJ, McIsaac RM, Chen LB. Anticarcinoma activity in vivo of rhodamine 123, a mitochondrial-specific dye. Science. 1983;222:169–172. - PubMed
    1. Cheng G, Zielonka J, Dranka BP, McAllister D, Mackinnon AC, Jr, Joseph J, Kalyanaraman B. Mitochondria-targeted drugs synergize with 2-deoxyglucose to trigger breast cancer cell death. Cancer Res. 2012;72:2634–2644. - PMC - PubMed
    1. Cheng G, Zielonka J, McAllister DM, Mackinnon AC, Jr, Joseph J, Dwinell MB, Kalyanaraman B. Mitochondria-targeted vitamin E analogs inhibit breast cancer cell energy metabolism and promote cell death. BMC Cancer. 2013;13:285. - PMC - PubMed

Publication types

MeSH terms