. 2014 Jul 18;289(29):20209-21.
doi: 10.1074/jbc.M113.544494. Epub 2014 May 27.

Activated hepatic stellate cells are dependent on self-collagen, cleaved by membrane type 1 matrix metalloproteinase for their growth

Affiliations

Activated hepatic stellate cells are dependent on self-collagen, cleaved by membrane type 1 matrix metalloproteinase for their growth

Naoko Kubo Birukawa et al. J Biol Chem. .

Abstract

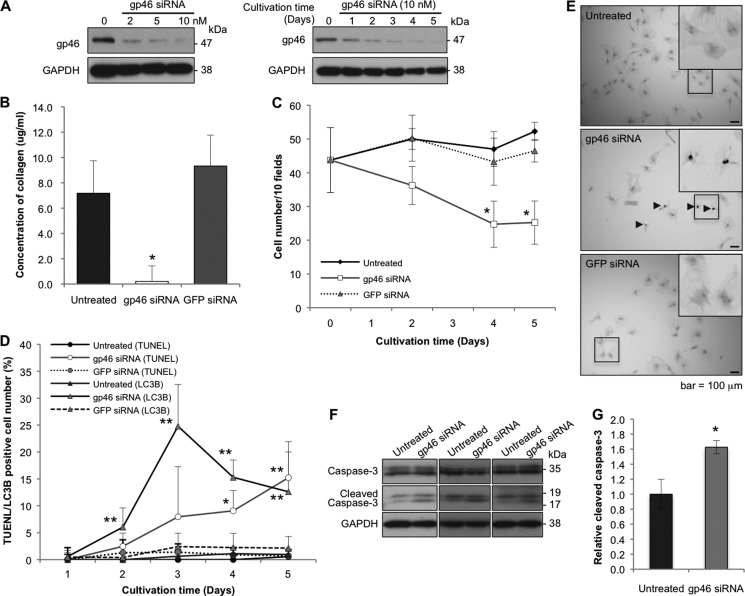
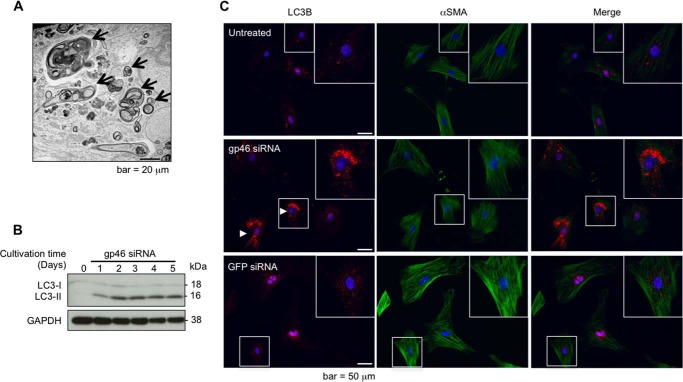
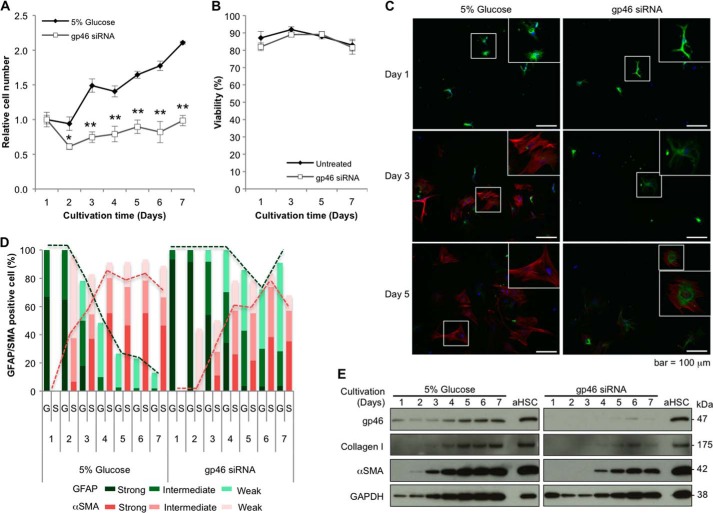
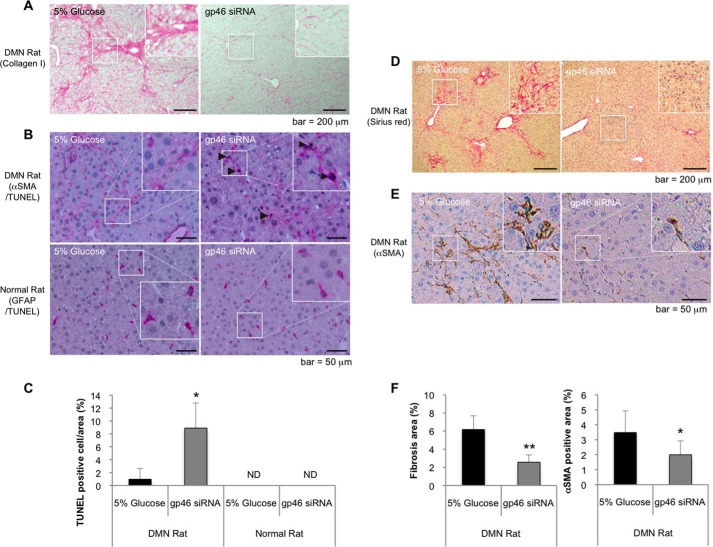
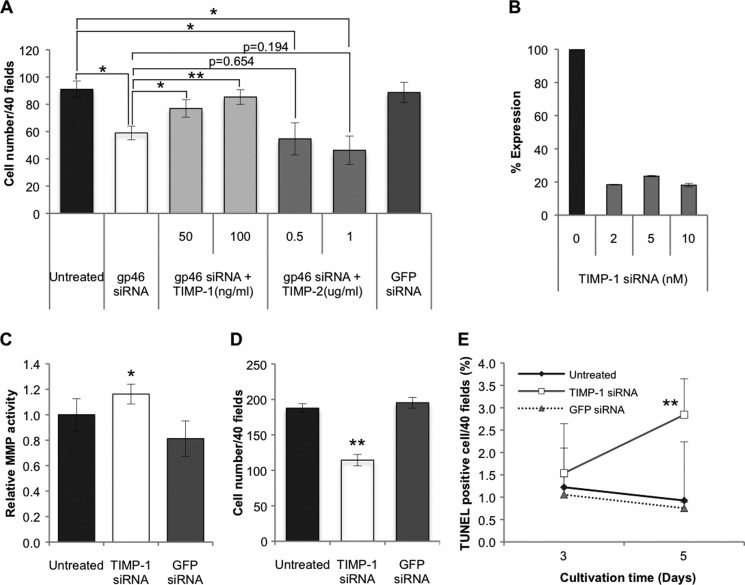
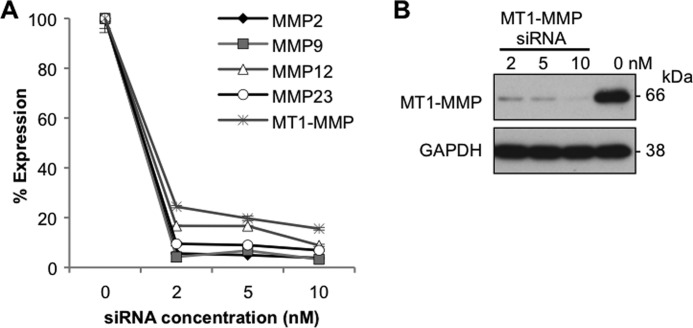
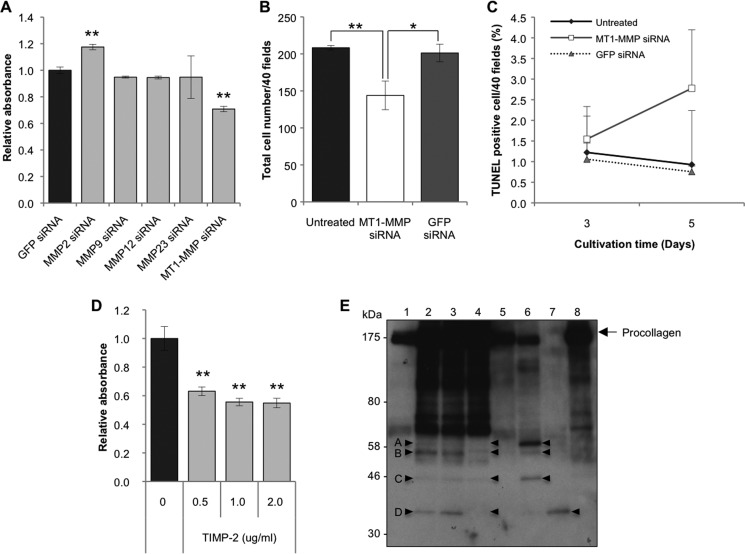
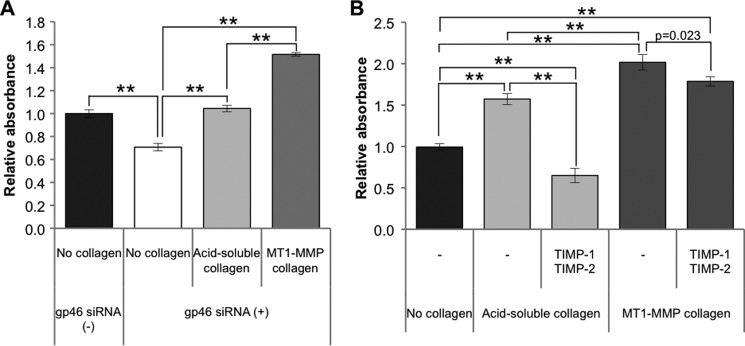
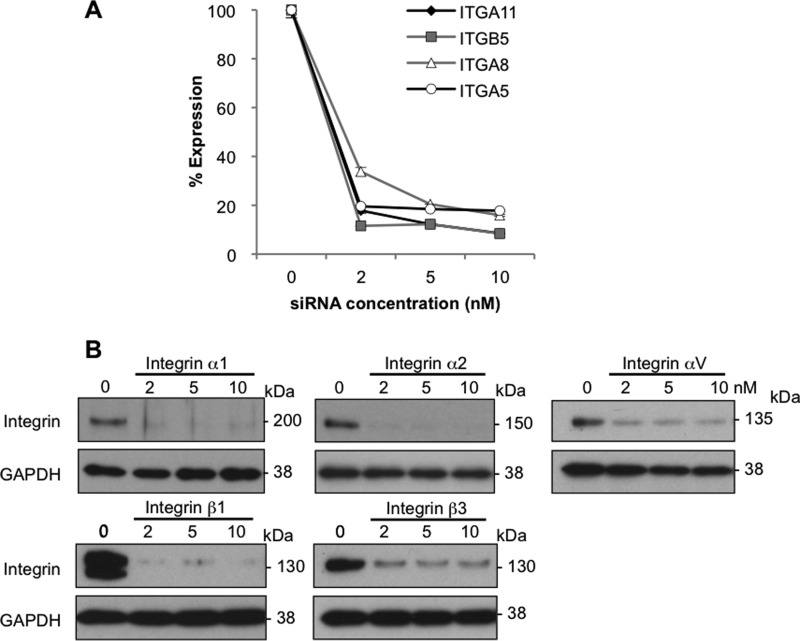
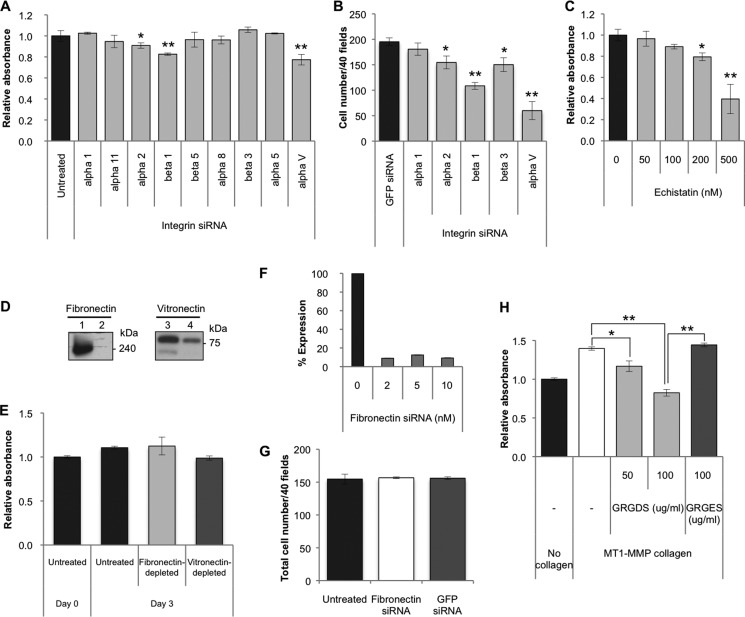
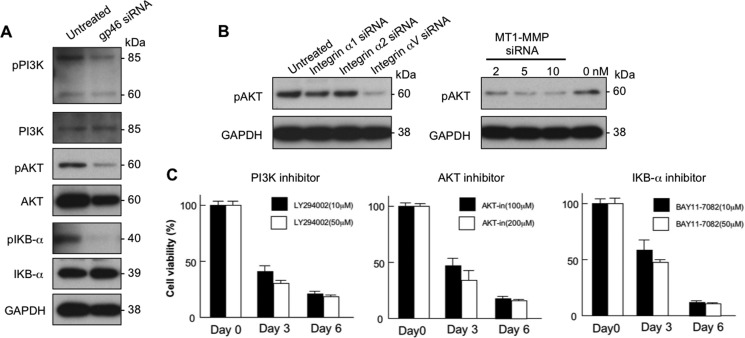
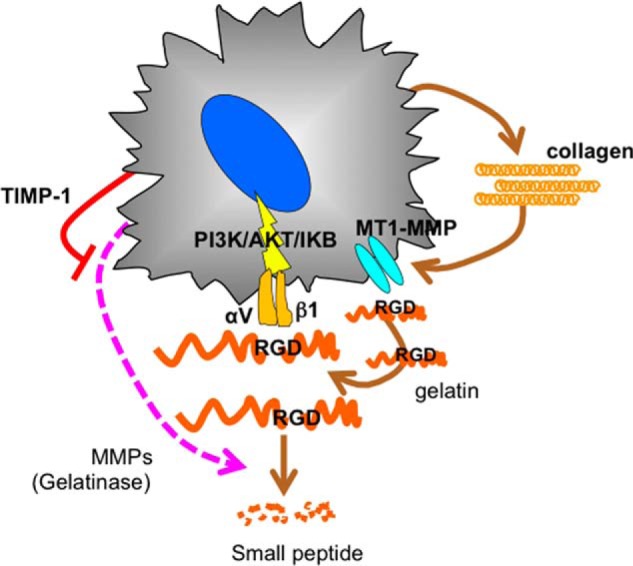
Stellate cells are distributed throughout organs, where, upon chronic damage, they become activated and proliferate to secrete collagen, which results in organ fibrosis. An intriguing property of hepatic stellate cells (HSCs) is that they undergo apoptosis when collagen is resolved by stopping tissue damage or by treatment, even though the mechanisms are unknown. Here we disclose the fact that HSCs, normal diploid cells, acquired dependence on collagen for their growth during the transition from quiescent to active states. The intramolecular RGD motifs of collagen were exposed by cleavage with their own membrane type 1 matrix metalloproteinase (MT1-MMP). The following evidence supports this conclusion. When rat activated HSCs (aHSCs) were transduced with siRNA against the collagen-specific chaperone gp46 to inhibit collagen secretion, the cells underwent autophagy followed by apoptosis. Concomitantly, the growth of aHSCs was suppressed, whereas that of quiescent HSCs was not. These in vitro results are compatible with the in vivo observation that apoptosis of aHSCs was induced in cirrhotic livers of rats treated with siRNAgp46. siRNA against MT1-MMP and addition of tissue inhibitor of metalloproteinase 2 (TIMP-2), which mainly inhibits MT1-MMP, also significantly suppressed the growth of aHSCs in vitro. The RGD inhibitors echistatin and GRGDS peptide and siRNA against the RGD receptor αVβ1 resulted in the inhibition of aHSCs growth. Transduction of siRNAs against gp46, αVβ1, and MT1-MMP to aHSCs inhibited the survival signal of PI3K/AKT/IκB. These results could provide novel antifibrosis strategies.

Keywords: Apoptosis; Extracellular Matrix; Fibrosis; Heat Shock Protein (HSP); Integrin.


Figures

FIGURE 1.
FIGURE 1.
Effects of siRNAgp46 on gp46 expression, collagen secretion, and proliferation of aHSCs. A, aHSCs were treated with siRNAgp46 at 2, 5, and 10 nm in DMEM containing 2% FBS for 72 h. aHSCs were also treated with siRNAgp46 at 10 nm for 1–5 days. The dose- and time-dependent suppression of gp46 expression was analyzed by Western blotting. B, collagen secretion from siRNAgp46-treated aHSCs in culture medium containing 2% FBS was assayed at day 3 of transfection. The amount of collagen in four samples was quantified by spectrophotometry at 540 nm, and the absolute concentrations were deduced from the standard curve of rat tail collagen provided by the assay kit and expressed as mean ± S.E. *, p < 0.05 compared with siRNAGFP. C, aHSCs treated with siRNAgp46 at 10 nm in DMEM with 2% FBS for 1–5 days were stained with antibody against αSMA-Cy3 and DAPI. The number of cells was monitored by counting the stained cells in 10 random fields per slide. Data are mean ± S.D. of three independent experiments. *, p < 0.05 compared with siRNAGFP. D, aHSCs treated with siRNAgp46 at 10 nm in DMEM with 2% FBS for 1–5 days were stained for apoptotic change (TUNEL positivity) and for autophagic change with antibody against LC3B. The apoptotic and autophagy-induced cells were counted in 40 random fields/slide. Data are mean ± S.D. of three independent experiments. *, p < 0.05; **, p < 0.01 compared with siRNAGFP. E, representative photomicrographs of aHSCs undergoing apoptosis at day 5 of transfection. Arrowheads indicate TUNEL-positive cells. Scale bars = 100 μm. F, expression of caspase 3 and cleaved caspase 3 was analyzed for aHSCs treated with 10 nm of siRNAgp46 in DMEM containing 2% FBS for 3 days to examine the effect of siRNAgp46 on apoptosis induction. G, quantitative analyses of levels of cleaved caspase 3 protein in untreated and gp46 siRNA-treated aHSCs. The results are mean ± S.D. of three samples. *, p < 0.05.
FIGURE 2.
FIGURE 2.
Effects of siRNAgp46 on autophagy induction of aHSCs. A, representative transmission electron microscopic photographs of aHSCs treated with siRNAgp46 at 10 nm for 3 days showing autophagosomes (arrows). Scale bar = 20 μm. B, aHSCs were treated with siRNAgp46 at 10 nm for 1–5 days, and the induction of autophagy was confirmed by Western blotting analysis of LC3, which exists in two forms, the 18-kDa cytosolic protein (LC3-I) and the processed 16-kDa form (LC3-II), which associates with autophagosome membranes. C, representative immunofluorescent images of LC3B visualized by Alexa Fluor 555-conjugated antibody (red, left column), αSMA visualized by Alexa Fluor 488-conjugated antibody (green, center column), and merged images (right column) with nuclei counterstained by DAPI (blue) in HSCs at day 3 of transfection. Scale bar = 50 μm.
FIGURE 3.
FIGURE 3.
Effects of siRNAgp46 on proliferation and expression of GFAP, αSMA, gp46, and collagen I of qHSCs. A, qHSCs isolated from Sprague-Dawley rats injected intravenously with 5% glucose or VA-lip-siRNAgp46 four times were further transfected with 10 nm of siRNAGFP or siRNAgp46, respectively, in DMEM containing 10% FBS. In vitro cell proliferation was monitored by counting the number of cells for 7 days. Results are expressed as percentage of cell number of HSCs at day 1 as mean ± S.D. of triplicate samples. *, p < 0.05; **, p < 0.01. B, viability of qHSCs treated with 10 nm of siRNAgp46 was examined by dye exclusion assay at days 1, 3, 5, and 7 of transfection. Data are mean ± S.D. of triplicate samples. C, representative immunofluorescent images of GFAP visualized by Alexa Fluor 488-conjugated antibody (green) and αSMA by Cy3-conjugated antibody (red) and DAPI (blue) in HSCs at days 1, 3, and 5 after transfection of siRNAGFP or siRNAgp46 using fluorescent microscopy (Keyence Corp., BZ-8000). Scale bars = 100 μm. D, qHSCs treated with siRNAGFP or siRNAgp46 for 7 days were stained with antibody against GFAP and αSMA. The numbers of cells showing strong (clear), intermediate, and weak staining for either GFAP (G) and αSMA (S) were counted in three random fields/slide, and results are expressed in percentages. E, protein was extracted from qHSCs treated with siRNAGFP or siRNAgp46 at 10 nm in the presence of 10% FBS for 7 days. The suppression of gp46, collagen, and αSMA expression was analyzed by Western blotting.
FIGURE 4.
FIGURE 4.
Apoptosis of rat HSCs induced by VA-lip-siRNAgp46 treatment in DMN-treated and normal control rats. A, representative photomicrographs of collagen I immunostaining in the livers of DMN-treated rats that were injected with 5% glucose or VA-lip-siRNAgp46, respectively, four times every other day. Scale bars = 200 μm. B, apoptotic HSCs were labeled with fluorescein incorporated in DNA strand breaks by terminal deoxynucleotidyl transferase and visualized by HRP-conjugated anti-fluorescein antibody (brown). Representative photomicrographs of apoptotic HSCs were obtained from livers of DMN-treated and normal control rats that were injected with 5% glucose or VA-lip-siRNAgp46, respectively, four times every other day. aHSCs in cirrhotic rats and qHSCs in normal rats were stained with antibodies against αSMA and GFAP, respectively, that were visualized by alkaline phosphatase-conjugated antibody (pink). Scale bars = 50 μm. C, apoptotic and total nuclei were counted in four randomly selected fields per slide for each indicated treatment. Data were expressed in percentages as mean ± S.D. ND, not detectable. *, p < 0.05. D and E, representative photomicrographs of Sirius red (D) and αSMA (E) staining in the livers of cirrhosis rat injected with 5% glucose or VA-lip-siRNAgp46 (2), respectively, five times every other day. Scale bars = 200 μm, 50 μm. F, fibrosis and the αSMA-positive area were examined in 4 slides/liver for each individual. Data are shown in percentages as mean ± S.D. of nine rats.**, p < 0.01; *, p < 0.05.
FIGURE 5.
FIGURE 5.
Effects of TIMPs and siRNATIMP-1 on proliferation or apoptosis induction of aHSCs pretreated with or without siRNAgp46. A, aHSCs transduced with 10 nm of siRNAgp46 were treated with recombinant rat TIMP-1 (50, 100 ng/ml) or mouse TIMP-2 (0. 5, 1.0 μg/ml), (the sequence is identical to rat TIMP-2 protein) in DMEM containing 2% FBS for 3 days. The number of cells stained with antibody against αSMA-Cy3 was counted in 40 random fields per slide. Data are presented as mean ± S.D. of triplicate samples. *, p < 0.05; **, p < 0.01. B, efficient knockdown of TIMP-1 was confirmed by quantitative RT-PCR at day 2 of transfection. C, MMP activity of the culture medium of aHSCs transduced with 10 nm of siRNATIMP-1 in serum-free DMEM for 24–72 h of transfection was assessed with fluorogenic MMP substrate. The fluorescence signal was measured using a microplate reader (340/485 nm), and results were expressed in percentages of MMP activity as mean ± S.D. *, p < 0.05 compared with siRNAGFP. D, cell numbers of aHSCs transduced with siRNATIMP-1 at 10 nm in DMEM with 2% FBS at day 3 of transfection were counted after they were stained with antibody against αSMA-Cy3 in 40 random fields per slide. Data are represented as mean ± S.D. of three independent experiments. **, p < 0.01 compared with siRNAGFP. E, aHSCs treated with siRNATIMP-1 in DMEM containing 2% FBS for 3 and 5 days were stained for apoptotic change. The apoptotic cells were counted in 40 random fields per slide. Data are mean ± S.D. of three independent experiments. **, p < 0.01 compared with siRNAGFP.
FIGURE 6.
FIGURE 6.
Silencing effects of siRNAs against MMPs. A, aHSCs were treated with siRNA against MMP2, MMP9, MMP12, MMP23, and MT1-MMP at 2, 5, and 10 nm in DMEM containing 10% FBS for 48 h. Suppression of MMP expression was quantitated by quantitative RT-PCR. B, aHSCs were treated with siRNAMT1-MMP at 2, 5, and 10 nm in DMEM containing 10% FBS for 72 h. Expression of MT1-MMP in the cells was analyzed by Western blotting.
FIGURE 7.
FIGURE 7.
Effects of silencing of MMPs on proliferation or apoptosis induction and secretion of collagen by aHSCs. A, a WST-1 assay was carried out for cells treated with 10 nm of MMP siRNA in DMEM containing 10% FBS at day 3 of transfection using a Premix assay system. Data are expressed in percentages of aHSCs treated with siRNAGFP as mean ± S.D. of triplicate samples. **, p < 0.01 compared with siRNAGFP. B, aHSCs were treated with siRNAMT1-MMP at 10 nm in DMEM with 10% FBS for 72 h. Cell numbers were counted after they were stained with antibody against αSMA-Cy3 in 40 random fields per slide. Results are shown as mean ± S.D. of three independent experiments. *, p < 0.05; **, p < 0.01 compared with control. C, aHSCs treated with siRNAMT1-MMP for 3 and 5 days were stained for apoptosis. The apoptotic cells were counted in 40 random fields per slide. Data are the mean ± S.D. of three independent experiments. D, mouse recombinant TIMP-2 at 0.5–2.0 μg/ml were added to the culture medium of aHSCs containing 2% FBS and incubated for 48 h. Proliferation of aHSCs was quantified using the Premix WST-1 assay system, and results were expressed in percentages of cell numbers of untreated aHSCs as mean ± S.D. of six independent samples. **, p < 0.01 compared with untreated aHSCs. E, cell lysate (lane 1), culture medium (lanes 2-4), and MT1-MMP added culture medium (lanes 5-8) from aHSCs were analyzed by Western blotting with anti-collagen antibody. In the samples of lanes 3 and 4, TIMP-1 (0.2 μg/ml) and TIMP-2 (2 μg/ml) were added, respectively, and incubated for 48 h (serum-free) prior to being subjected to electrophoresis. The samples of lanes 5–7 were incubated with 20, 100, and 500 ng of MT1-MMP, respectively, for 16 h at 25 °C prior to electrophoresis. To the sample of lane 8, 500 ng of MT1-MMP and 0.4 μg of TIMP-2 were added. The arrowheads in A–D indicate peptides specifically cleaved by MT1-MMP.
FIGURE 8.
FIGURE 8.
Proliferation of siRNAgp46 aHSCs incubated with acid-soluble or MT1-MMP-cleaved collagen in the presence or absence of TIMPs. A, proliferation of siRNAgp46 aHSCs incubated with acid-soluble or MT1-MMP-cleaved collagen in DMEM containing 2% FBS was measured at day 3 of transfection by the WST-1 assay system. Data are expressed in percentages of the cell growth of control aHSCs as mean ± S.D. of triplicate samples. **, p < 0.01. B, proliferation of cells treated with TIMP-1 (100 ng/ml) and TIMP-2 (1 μg/ml) incubated with acid-soluble or MT1-MMP-cleaved collagen in serum-free DMEM was measured at day 3. Results are expressed in percentage as mean ± S.D. of three independent experiments. **, p < 0.01.
FIGURE 9.
FIGURE 9.
Silencing effects of integrin siRNAs. A, aHSCs were treated with siRNA against integrin α11, β5, α8, and α5 at 2, 5, and 10 nm in DMEM containing 10% FBS for 48 h. The expression of integrin in those cells was quantitated by quantitative RT-PCR. B, expression of integrin in aHSCs treated with siRNA against integrin α1, α2, αV, β1, and β3 was analyzed by Western blotting.
FIGURE 10.
FIGURE 10.
Effects of silencing of integrins on proliferation of aHSCs. A, a WST-1 assay was carried out for cells treated with siRNA against integrin α1, α11, α2, β1, β5, α8, β3, α5, and αV at a concentration of 5 nm in DMEM containing 2% FBS at day 3 of transfection. Data are expressed in percentages of untreated aHSCs as mean ± S.D. of six independent samples. *, p < 0.05; **, p < 0.01 compared with untreated aHSCs. B, the number of cells treated with integrin α1, α2, β1, β3, and αV siRNAs at 5 nm in DMEM containing 2% FBS was counted at day 3 of transfection after they were stained with antibody against αSMA-Cy3 in 40 random fields per slide. Data are expressed as mean ± S.D. of three independent experiments. *, p < 0.05; **, p < 0.01 compared with siRNAGFP. C, the proliferation of aHSCs treated with echistatin at 50, 100, 200, and 500 nm in serum-free DMEM for 24 h was measured by the WST-1 assay system. Data are expressed in percentages as mean ± S.D. of six independent samples. *, p < 0.05; **, p < 0.01 compared with untreated aHSCs. D, fibronectin and vitronectin in FBS were removed by gelatin-Sepharose- or heparin-packed columns, respectively. Depletion of fibronectin (lane 2) and vitronectin (lane 4) from FBS was examined by Western blotting using antibody against fibronectin and vitronectin, respectively, with control FBS (lanes 1 and 3). E, aHSC were cultured in medium containing 10% FBS from which fibronectin and vitronectin were removed. The proliferation of aHSCs was quantified using the Premix WST-1 assay system at day 3 of treatment. No significant differences were observed. Data are expressed in percentages compared with untreated samples as mean ± S.D. of triplicate samples. F, knockdown of Fibronectin was examined by quantitative RT-PCR at day 2 of transfection. G, cell numbers of aHSCs transduced with siRNAFibronectin at 10 nm in DMEM with 2% FBS at day 3 of transfection were counted after they were stained with antibody against αSMA-Cy3 in 40 random fields/slide. Data are representated as mean ± S.D. of three independent experiments. H, aHSCs in an MT1-MMP collagen-coated plate were incubated with GRGDS (50 and 100 μg/ml) or GRGES (100 μg/ml) peptides for 72 h in serum-free DMEM. A WST-1 assay was carried out, and data are expressed in percentages of cell growth of control aHSCs as mean ± S.D. of triplicate samples. *, p < 0.05; **p < 0.01.
FIGURE 11.
FIGURE 11.
Molecular transduction survival signal of aHSCs. A, aHSCs treated with or without 10 nm of siRNAgp46 in DMEM containing 2% FBS for 3 days were examined for expression of PI3K, AKT, and IκB-α and their phosphorylated forms (pPI3K, pAKT, and pIκBα) by Western blotting. B, the effect of treatment of 5 nm of integrin siRNA and 2, 5, and 10 nm of siRNAMT1-MMP on phosphorylation of AKT of aHSCs was analyzed by Western blotting at day 3. C, the viability of aHSCs treated with inhibitors to PI3K, AKT, and IκB-α was analyzed on days 0, 3, and 6 by the WST-1 assay system. Data are expressed in percentages of cell viability compared with untreated aHSCs and as mean ± S.D. of triplicate samples.
FIGURE 12.
FIGURE 12.
Schematic of the autocrine loop of aHSC for survival. aHSCs become dependent on collagen, which is cleaved by its own MT1-MMP, exposing the internal RGD motif and interacting with integrin αVβ1, thereby transducing the survival signal of PI3K/AKT/IκB.

References

    1. Zhao L., Burt A. D. (2007) The diffuse stellate cell system. J. Mol. Histol. 38, 53–64 - PubMed
    1. Boulter L., Govaere O., Bird T. G., Radulescu S., Ramachandran P., Pellicoro A., Ridgway R. A., Seo S. S., Spee B., Van Rooijen N., Sansom O. J., Iredale J. P., Lowell S., Roskams T., Forbes S. J. (2012) Macrophage-derived Wnt opposes Notch signaling to specify hepatic progenitor cell fate in chronic liver disease. Nat. Med. 18, 572–579 - PMC - PubMed
    1. Yin C., Evason K. J., Asahina K., Stainier D. Y. (2013) Hepatic stellate cells in liver development, regeneration, and cancer. J. Clin. Invest. 123, 1902–1910 - PMC - PubMed
    1. Hemmann S., Graf J., Roderfeld M., Roeb E. (2007) Expression of MMPs and TIMPs in liver fibrosis: a systematic review with special emphasis on anti-fibrotic strategies. J. Hepatol. 46, 955–975 - PubMed
    1. Iredale J. P., Benyon R. C., Pickering J., McCullen M., Northrop M., Pawley S., Hovell C., Arthur M. J. (1998) Mechanisms of spontaneous resolution of rat liver fibrosis. Hepatic stellate cell apoptosis and reduced hepatic expression of metalloproteinase inhibitors. J. Clin. Invest. 102, 538–549 - PMC - PubMed

MeSH terms