. 2014 Jul 25;289(30):20991-1002.
doi: 10.1074/jbc.M114.560680. Epub 2014 May 27.

Identification of receptor binding-induced conformational changes in non-visual arrestins

Affiliations

Identification of receptor binding-induced conformational changes in non-visual arrestins

Ya Zhuo et al. J Biol Chem. .

Abstract

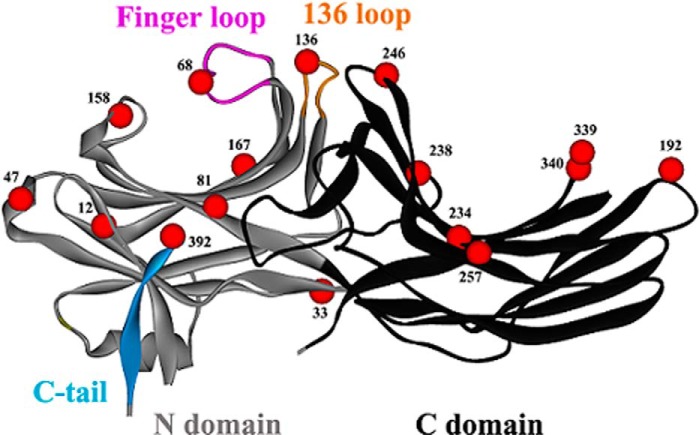
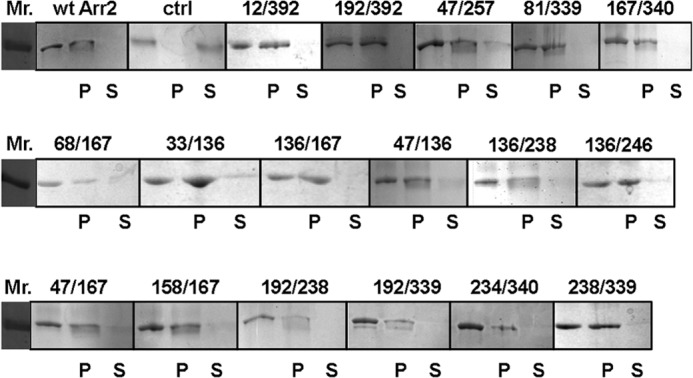
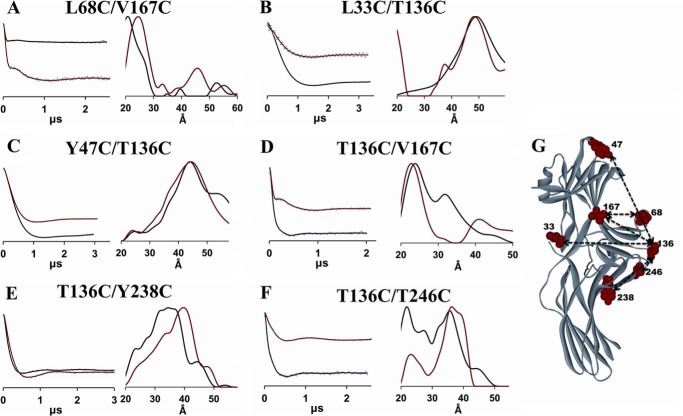
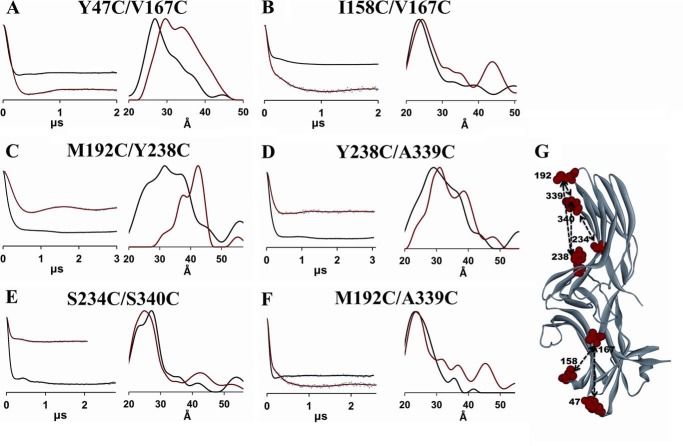
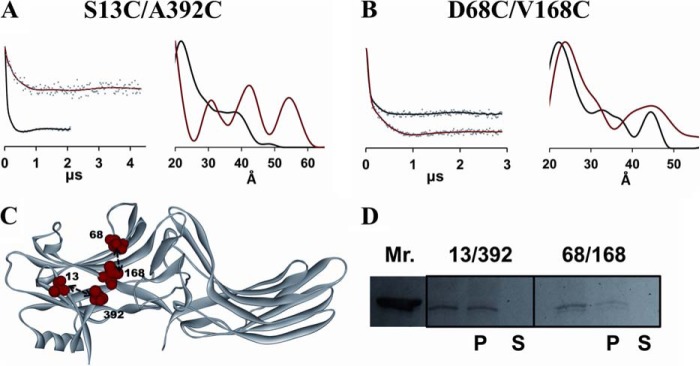
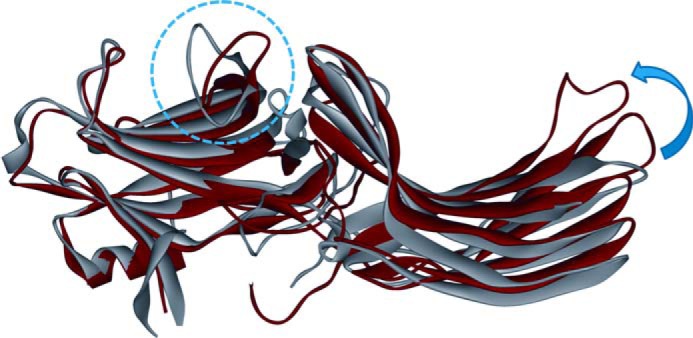
The non-visual arrestins, arrestin-2 and arrestin-3, belong to a small family of multifunctional cytosolic proteins. Non-visual arrestins interact with hundreds of G protein-coupled receptors (GPCRs) and regulate GPCR desensitization by binding active phosphorylated GPCRs and uncoupling them from heterotrimeric G proteins. Recently, non-visual arrestins have been shown to mediate G protein-independent signaling by serving as adaptors and scaffolds that assemble multiprotein complexes. By recruiting various partners, including trafficking and signaling proteins, directly to GPCRs, non-visual arrestins connect activated receptors to diverse signaling pathways. To investigate arrestin-mediated signaling, a structural understanding of arrestin activation and interaction with GPCRs is essential. Here we identified global and local conformational changes in the non-visual arrestins upon binding to the model GPCR rhodopsin. To detect conformational changes, pairs of spin labels were introduced into arrestin-2 and arrestin-3, and the interspin distances in the absence and presence of the receptor were measured by double electron electron resonance spectroscopy. Our data indicate that both non-visual arrestins undergo several conformational changes similar to arrestin-1, including the finger loop moving toward the predicted location of the receptor in the complex as well as the C-tail release upon receptor binding. The arrestin-2 results also suggest that there is no clam shell-like closure of the N- and C-domains and that the loop containing residue 136 (homolog of 139 in arrestin-1) has high flexibility in both free and receptor-bound states.

Keywords: Arrestin; Electron Paramagnetic Resonance (EPR); G Protein-coupled Receptor (GPCR); Rhodopsin; Spectroscopy.


Figures

FIGURE 1.
FIGURE 1.
Crystal structure of arrestin-2 in the basal conformation (PDB entry 1G4M) with the residues studied by DEER spectroscopy shown as red CαCPK models. The backbone structure of the N domain is shown in gray, and the backbone structure of the C domain is shown in black. The major structural features of arrestin-2 are indicated.
FIGURE 2.
FIGURE 2.
PR* binding of all spin-labeled arrestin-2 cysteine mutants used in this study. The ability of each arrestin-2 mutant to bind to PR* was tested. Wild-type arrestin-2 in the presence (wt Arr2) and absence (ctrl) of PR* are shown as positive and negative controls, respectively. Added arrestin-2 (blank), arrestin-2 in the pellet fraction (P), and arrestin-2 in the supernatant (S) fraction are shown for each protein. Arrestin binding to PR* is indicated by the presence of this protein in the pellet, whereas unbound arrestin is found in the supernatant fraction.
FIGURE 3.
FIGURE 3.
DEER analysis of the movement of the C-tail and arrestin-2 domains. Fits to the free (black) and PR*-bound (red) background-corrected dipolar evolution data (gray dots) are plotted on the left for the C-tail (A and B) and interdomain (C–E) mutants to illustrate the data quality and support the distance distribution data. The corresponding distance distributions are shown on the right as overlays for the free (black) and PR*-bound (red) states. F, the free state crystal structure (Protein Data Bank entry 1G4M) of arrestin-2 is labeled with each pair of double mutants (red spheres). Measured distances are shown as dotted lines.
FIGURE 4.
FIGURE 4.
DEER analysis of the movement of the finger loop and the loop containing residue 136. Fits to the free (black) and PR*-bound (red) background-corrected dipolar evolution data (gray dots) are plotted on the left for the finger loop (A) and the loop containing residue 136 mutants (B–F) to illustrate the data quality and support the distance distribution data. The corresponding distance distributions are shown on the right as overlays for the free (black) and PR*-bound (red) states. G, the positions of the spin labels are shown as red CPK models on the crystal structure of the free state (PDB entry 1G4M) of arrestin-2. Measured distances are shown as dotted lines.
FIGURE 5.
FIGURE 5.
DEER analysis of the conformational changes in the N- and C-domains of arrestin-2. Fits to the free (black) and PR*-bound (red) background-corrected dipolar evolution data (gray dots) are plotted on the left for the N-domain (A and B) and the C-domain mutants (C–F) to illustrate the data quality and support the distance distribution data. The corresponding distance distributions are shown on the right as overlays for the free (black) and PR*-bound (red) states. G, the positions of the spin labels are shown as red CPK models on the crystal structure of the free state (PDB entry 1G4M) of arrestin-2. Measured distances are shown as dotted lines.
FIGURE 6.
FIGURE 6.
A and B, DEER analysis for two arrestin-3 spin-labeled double mutants. Fits to the free (black) and PR*-bound (red) background-corrected dipolar evolution data (gray dots) are plotted on the left to illustrate the data quality and support the distance distribution data. The corresponding distance distributions are shown on the right as overlays for the free (black) and PR*-bound (red) states. C, the free state crystal structure of arrestin-3 (PDB entry 3P2D) is labeled with the double mutants (red spheres) used for the DEER study. D, pull-down assay results for the spin-labeled arrestin-3 protein pairs.
FIGURE 7.
FIGURE 7.
The crystal structures of inactive arrestin-2 (PDB entry 1G4M) and V2Rpp-bound arrestin-2 (PDB entry 4JQI) overlaid by alignment of the N domains. The inactive structure is shown in gray, and the phosphorylated receptor peptide-bound structure is shown in red. The conformational change of the finger loop is highlighted by the blue dotted circle. The interdomain rotation observed in the crystal structure is indicated by the blue arrow.

References

    1. Lagerström M. C., Schiöth H. B. (2008) Structural diversity of G protein-coupled receptors and significance for drug discovery. Nat. Rev. Drug Discov. 7, 339–357 - PubMed
    1. Pierce K. L., Premont R. T., Lefkowitz R. J. (2002) Seven-transmembrane receptors. Nat. Rev. Mol. Cell Biol. 3, 639–650 - PubMed
    1. Lefkowitz R. J., Shenoy S. K. (2005) Transduction of receptor signals by β-arrestins. Science 308, 512–517 - PubMed
    1. Hirsch J. A., Schubert C., Gurevich V. V., Sigler P. B. (1999) A model for arrestin's regulation: the 2.8 Å crystal structure of visual arrestin. Cell 97, 257–269 - PubMed
    1. DeWire S. M., Ahn S., Lefkowitz R. J., Shenoy S. K. (2007) β-Arrestins and Cell Signaling. Annu. Rev. Physiol. 69, 483–510 - PubMed

Publication types

LinkOut - more resources