. 2014 Aug;58(8):4573-82.
doi: 10.1128/AAC.02463-14. Epub 2014 May 27.

Antagonism between bacteriostatic and bactericidal antibiotics is prevalent

Affiliations

Antagonism between bacteriostatic and bactericidal antibiotics is prevalent

Paolo S Ocampo et al. Antimicrob Agents Chemother. 2014 Aug.

Abstract

Combination therapy is rarely used to counter the evolution of resistance in bacterial infections. Expansion of the use of combination therapy requires knowledge of how drugs interact at inhibitory concentrations. More than 50 years ago, it was noted that, if bactericidal drugs are most potent with actively dividing cells, then the inhibition of growth induced by a bacteriostatic drug should result in an overall reduction of efficacy when the drug is used in combination with a bactericidal drug. Our goal here was to investigate this hypothesis systematically. We first constructed time-kill curves using five different antibiotics at clinically relevant concentrations, and we observed antagonism between bactericidal and bacteriostatic drugs. We extended our investigation by performing a screen of pairwise combinations of 21 different antibiotics at subinhibitory concentrations, and we found that strong antagonistic interactions were enriched significantly among combinations of bacteriostatic and bactericidal drugs. Finally, since our hypothesis relies on phenotypic effects produced by different drug classes, we recreated these experiments in a microfluidic device and performed time-lapse microscopy to directly observe and quantify the growth and division of individual cells with controlled antibiotic concentrations. While our single-cell observations supported the antagonism between bacteriostatic and bactericidal drugs, they revealed an unexpected variety of cellular responses to antagonistic drug combinations, suggesting that multiple mechanisms underlie the interactions.


Figures

FIG 1
FIG 1
Time-kill curves for single-drug and two-drug combinations. Each graph shows the time-kill curve for a bactericidal-bacteriostatic drug pair and the constituent individual drugs. Error bars represent standard errors of the mean (based on 3 independent replicates) for the number of culturable cells, as measured in CFU/ml at each time point. Antibiotic concentrations used were 25 μg/ml nalidixic acid (NAL), 25 μg/ml streptomycin (STR), 12.5 μg/ml tetracycline (TET), 200 μg/ml erythromycin (ERY), and 10 μg/ml trimethoprim (TRM).
FIG 2
FIG 2
Systematic exploration of interactions between bactericidal and bacteriostatic antibiotics at subinhibitory concentrations. (A) Heatmap showing pairwise interactions between 21 antibiotics measured systematically in E. coli. Antibiotics are grouped according to their modes of action, and colors reflect interaction scores. Negative and positive scores correspond to antagonism (blue) and synergism (red), respectively, according to Loewe additivity criteria. White, missing data. For antibiotic abbreviations and concentrations, see Table 1. (B) Graph showing that the combination of a bacteriostatic (stat) antibiotic with a bactericidal (cid) antibiotic has a tendency to show strong antagonism. Antibiotic pairs were categorized according to their individual antibiotic killing properties, leading to three major groups, i.e., bactericidal-bacteriostatic, bacteriostatic-bacteriostatic, and bactericidal-bactericidal. Antibiotic pairs with interaction scores (B) lower than −1 (i.e., those showing strong antagonism) were significantly more likely to fall in the bactericidal-bacteriostatic category than were the rest of the antibiotic pairs (P = 0.0016, Fisher's exact test).
FIG 3
FIG 3
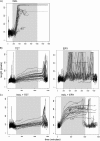
Length-time graphs for individual cells before, during, and after antibiotic exposure. At least 20 individual cells per antibiotic treatment were selected for analysis using custom software; the results of each treatment were collated in one graph, with each line representing the length of a single cell over time. Upward deflections of these lines denote increases in length, and abrupt downward deflections indicate division events. The shaded section in each graph denotes the period during which antibiotic-containing medium was used. Lines that end abruptly indicate lysis of the cell under observation. The analysis of a population subjected to erythromycin alone was problematic due to the formation of long filamentous cells that were drawn out of their growth channels as medium flowed through the primary trench of the device; this reduced the number of cells available for observation for the entire experiment. Furthermore, in the erythromycin panel, the large fluctuations in cell length indicate the increased size to which these cells were observed to grow, as well as the continuation of division events. The antibiotic concentrations used were 25 μg/ml nalidixic acid, 25 μg/ml streptomycin, 12.5 μg/ml tetracycline, 200 μg/ml erythromycin, and 10 μg/ml trimethoprim. (A) Cells treated with the bactericidal drug nalidixic acid either were lysed or were never found to resume division even after the medium had been changed to drug-free broth. (B) Tetracycline was observed to reduce elongation and completely prevent division during antibiotic exposure, while erythromycin only reduced division rates; this resulted in filamentous cells that were still capable of division, albeit at lower rates than cells grown in drug-free broth. (C) The combination of nalidixic acid and tetracycline produced growth dynamics similar to those observed with tetracycline alone. Erythromycin and nalidixic acid, however, induced filamentation and significantly reduced division. Both conditions resulted in large numbers of cells that were found to resume growth upon a return to drug-free broth.
FIG 4
FIG 4
Effects of single and paired antibiotics on cell division and elongation. We extracted the rates of division (A) and elongation (cell length doublings per hour) (B) from each of the individual cells included in our detailed analysis, and we present the distribution of these rates as box plots. Rates for the antibiotic-free LB broth condition were calculated by pooling the division and elongation rates for every individual cell across all conditions prior to drug exposure. Negative elongation rates are from filamentous cells that divide several times without elongation between division events. The boxes span the range between the upper and lower quartiles. Thick lines, medians; whiskers, highest and lowest values still within 1.5 interquartile ranges of the upper and lower quartiles, respectively; ○, data points outside this range.

References

    1. Bonhoeffer S, Lipsitch M, Levin BR. 1997. Evaluating treatment protocols to prevent antibiotic resistance. Proc. Natl. Acad. Sci. U. S. A. 94:12106–12111. 10.1073/pnas.94.22.12106 - DOI - PMC - PubMed
    1. Hand K. 2006. Tuberculosis: pharmacological management. Hosp. Pharm. 13:81–85
    1. Mocroft A, Vella S, Benfield TL, Chiesi A, Miller V, Gargalianos P, d'Arminio Monforte A, Yust I, Bruun JN, Phillips AN, Lundgren JD, EuroSIDA Study Group 1998. Changing patterns of mortality across Europe in patients infected with HIV-1. Lancet 352:1725–1730. 10.1016/S0140-6736(98)03201-2 - DOI - PubMed
    1. WHO. 2010. WHO guidelines for the treatment of malaria, 2nd ed. WHO, Geneva, Switzerland
    1. Gilbert DN, Moellering RC, Eliopoulos GM, Chambers HF, Saag MS. (ed). 2010. The Sanford guide to antimicrobial therapy, 40th ed. Antimicrobial Therapy, Inc., Sperryville, VA

Publication types

MeSH terms