

Nocturnal systemic hypotension increases the risk of glaucoma progression
- PMID: 24869467
- PMCID: PMC4386594
- DOI: 10.1016/j.ophtha.2014.04.016
Nocturnal systemic hypotension increases the risk of glaucoma progression
Abstract
Objective: The objective of this prospective, longitudinal study of patients with normal-tension glaucoma (NTG) was to determine whether patients with nocturnal hypotension are at greater risk for visual field (VF) loss over 12 months than those without nocturnal hypotension.
Design: Prospective, longitudinal study.
Participants: Consecutive patients with NTG with at least 5 prior VF tests were screened for eligibility.
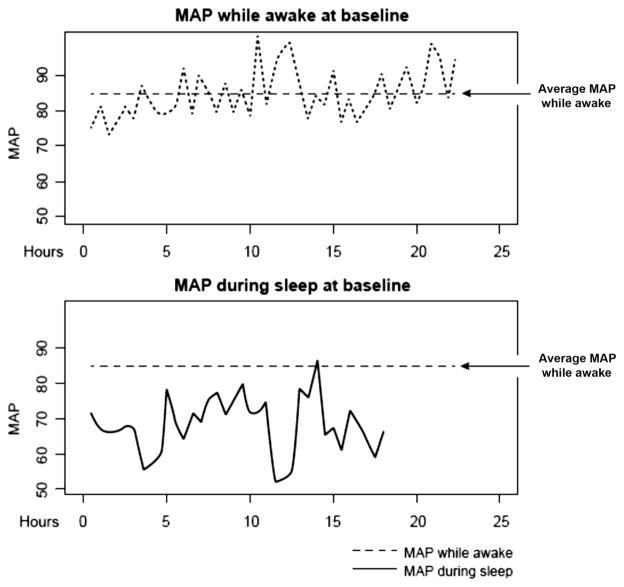
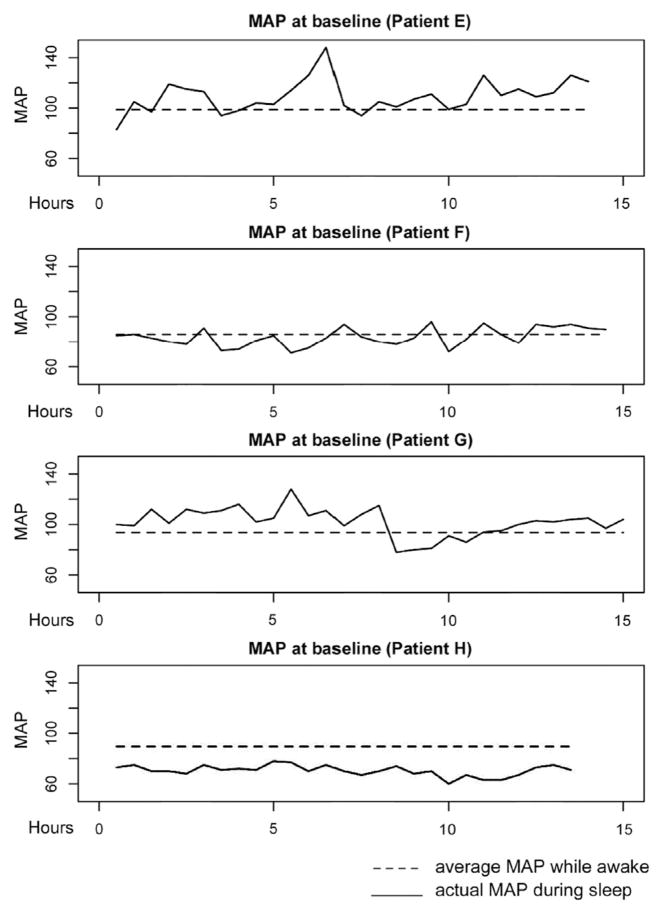
Methods: The baseline evaluation assessed demographic and clinical characteristics, covering systemic comorbid conditions, including systemic hypertension. All oral and ophthalmologic medications were recorded. A complete ophthalmological examination was performed at baseline and follow-up. Patients had their blood pressure (BP) monitored every 30 minutes for 48 hours with an ambulatory recording device at baseline and 6 and 12 months.
Main outcome measures: The primary outcome was based on the global rates of VF progression by linear regression of the mean VF threshold sensitivity over time (decibels/year).
Results: Eighty-five patients with NTG (166 eyes; mean age, 65 years; 67% were women) were included. Of the 85 patients, 29% had progressed in the 5 VFs collected before study enrollment. The nocturnal mean arterial pressure (MAP) was compared with the daytime MAP. Multivariate analysis showed that the total time that sleep MAP was 10 mmHg below the daytime MAP was a significant predictor of subsequent VF progression (P<0.02).
Conclusions: Cumulative nocturnal hypotension predicted VF loss in this cohort. Our data suggest that the duration and magnitude of decrease in nocturnal blood pressure below the daytime MAP, especially pressures that are 10 mmHg lower than daytime MAP, predict progression of NTG. Low nocturnal blood pressure, whether occurring spontaneously or as a result of medications, may lead to worsening of VF defects.
Copyright © 2014 American Academy of Ophthalmology. Published by Elsevier Inc. All rights reserved.
Figures


Comment in
-
Author reply: To PMID 24869467.Ophthalmology. 2015 Feb;122(2):e15-6. doi: 10.1016/j.ophtha.2014.08.001. Ophthalmology. 2015. PMID: 25618431 Free PMC article. No abstract available.
-
Re: Charlson et al.: nocturnal systemic hypotension increases the risk of glaucoma progression (Ophthalmology 2014;121:2004-10).Ophthalmology. 2015 Feb;122(2):e15. doi: 10.1016/j.ophtha.2014.08.002. Ophthalmology. 2015. PMID: 25618432 No abstract available.
-
Re: Charlson et al.: Nocturnal systemic hypotension increases the risk of glaucoma progression (Ophthalmology 2014;121:2004-12).Ophthalmology. 2015 Apr;122(4):e25-6. doi: 10.1016/j.ophtha.2014.08.042. Ophthalmology. 2015. PMID: 25797092 No abstract available.
-
Author reply: To PMID 24869467.Ophthalmology. 2015 Apr;122(4):e26-7. doi: 10.1016/j.ophtha.2014.08.044. Ophthalmology. 2015. PMID: 25797093 Free PMC article. No abstract available.
References
-
- Collaborative Normal-Tension Glaucoma Study Group. The effectiveness of intraocular pressure reduction in the treatment of normal-tension glaucoma. Am J Ophthalmol. 1998;126:498–505. - PubMed
-
- Leske MC, Heijl A, Hyman L, et al. EMGT Group. Predictors of long-term progression in the Early Manifest Glaucoma Trial. Ophthalmology. 2007;114:1965–72. - PubMed
-
- Kass MA, Heuer DK, Higginbotham EJ, et al. Ocular Hypertension Treatment Study Group. The Ocular Hypertension Treatment Study: a randomized trial determines that topical ocular hypotensive medication delays or prevents the onset of primary open-angle glaucoma. Arch Ophthalmol. 2002;120:701–13. discussion 829–30. - PubMed
-
- Francois J, Neetens A. The deterioration of the visual field in glaucoma and the blood pressure. Doc Ophthalmol. 1970;28:70–132. - PubMed
MeSH terms
Grants and funding
LinkOut - more resources
Full Text Sources
Other Literature Sources
Medical
