. 2014 Jul 24;124(4):598-610.
doi: 10.1182/blood-2013-12-542209. Epub 2014 May 28.

Muscleblind-like 1 (Mbnl1) regulates pre-mRNA alternative splicing during terminal erythropoiesis

Affiliations

Muscleblind-like 1 (Mbnl1) regulates pre-mRNA alternative splicing during terminal erythropoiesis

Albert W Cheng et al. Blood. .

Abstract

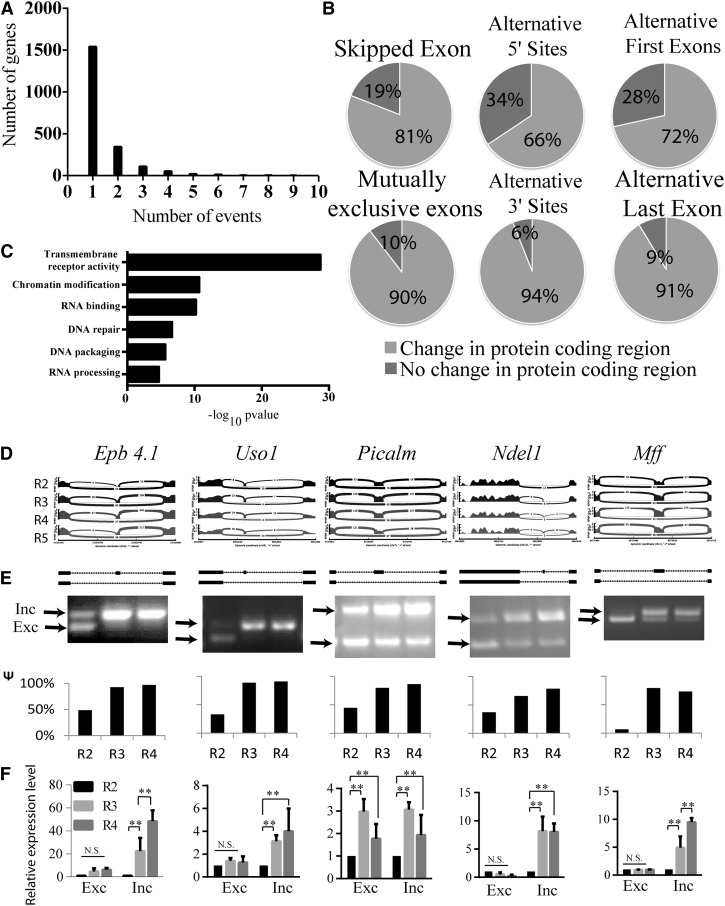
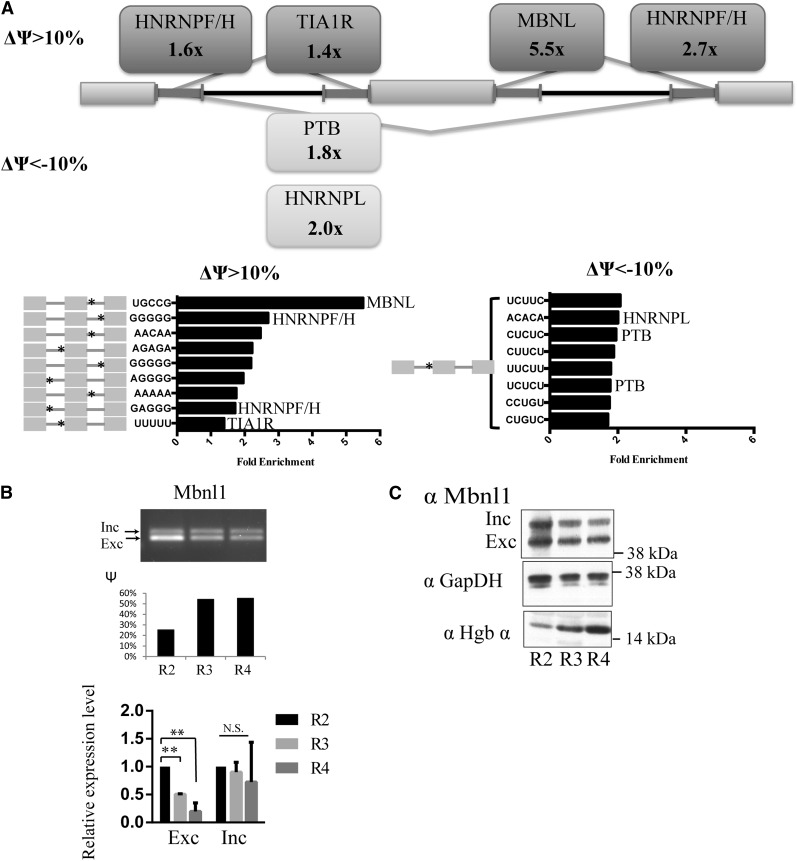
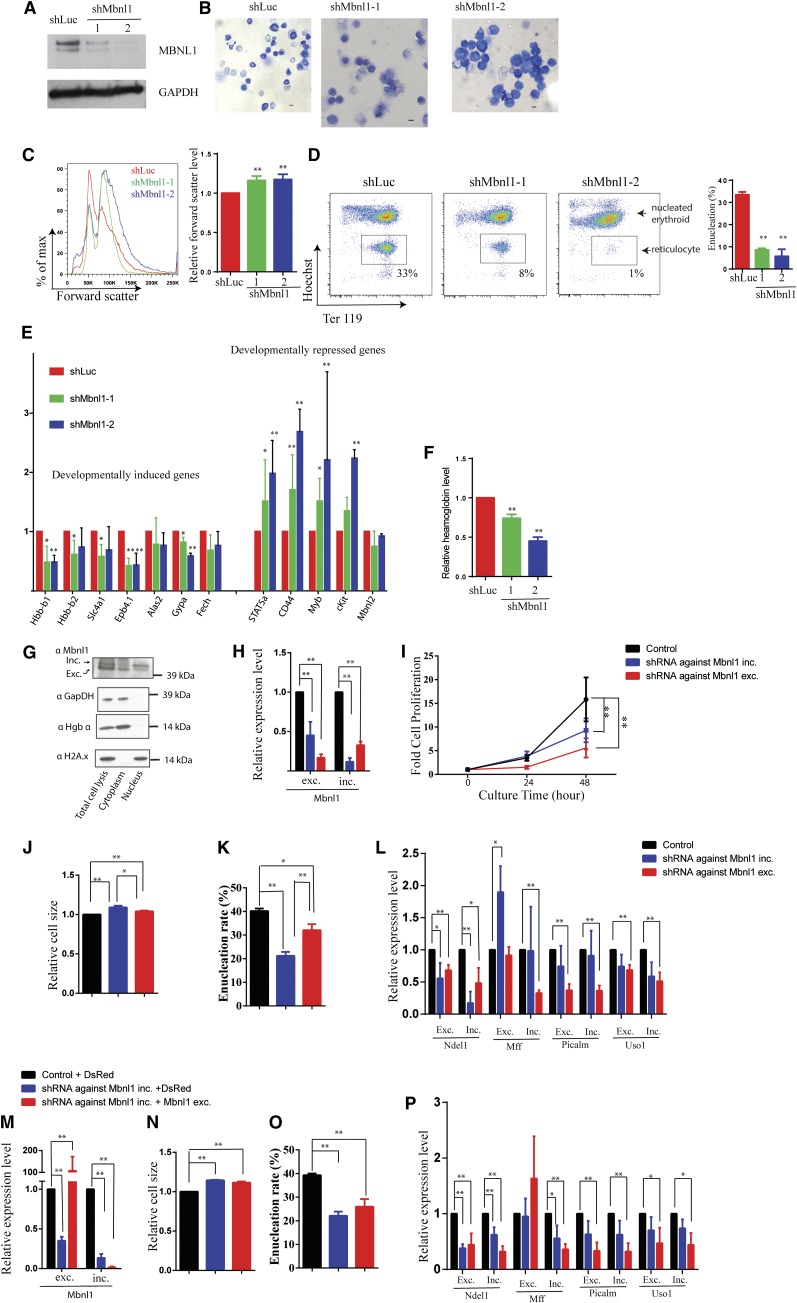
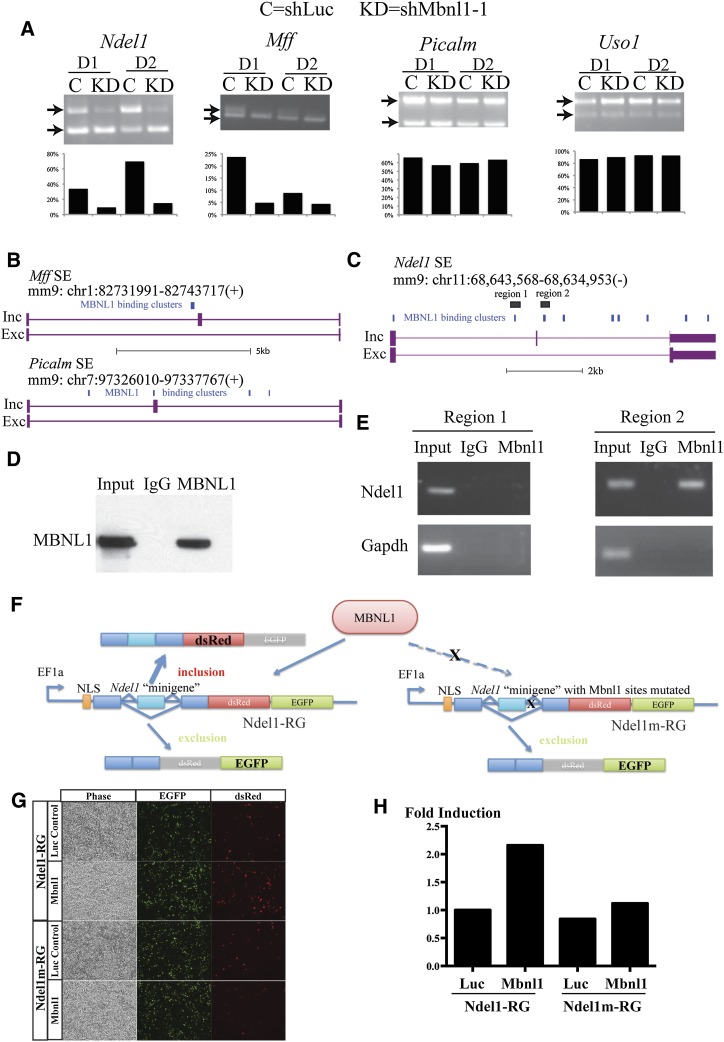
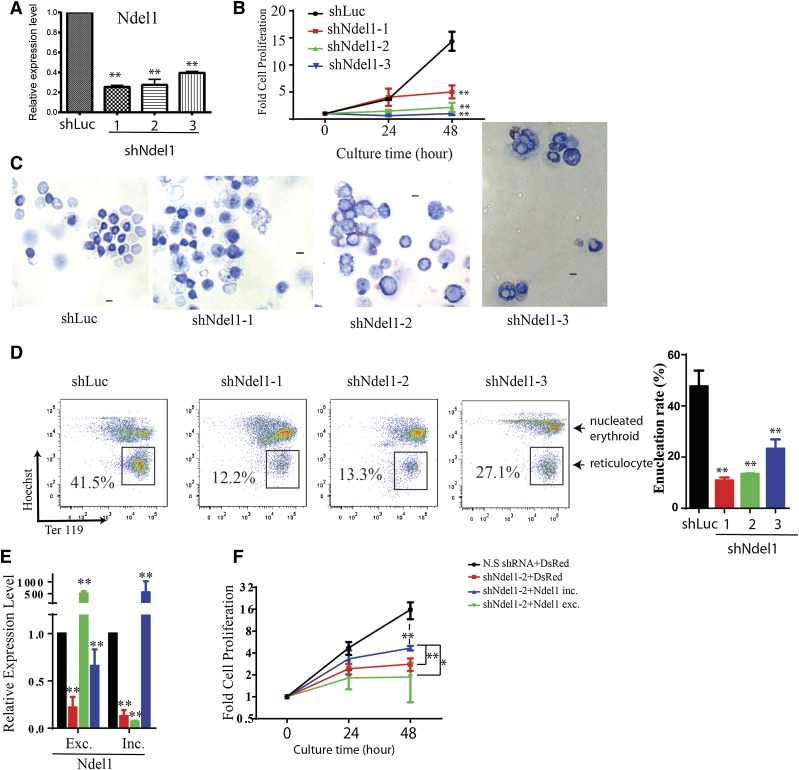
The scope and roles of regulated isoform gene expression during erythroid terminal development are poorly understood. We identified hundreds of differentiation-associated isoform changes during terminal erythropoiesis. Sequences surrounding cassette exons of skipped exon events are enriched for motifs bound by the Muscleblind-like (MBNL) family of splicing factors. Knockdown of Mbnl1 in cultured murine fetal liver erythroid progenitors resulted in a strong block in erythroid differentiation and disrupted the developmentally regulated exon skipping of Ndel1 mRNA, which is bound by MBNL1 and critical for erythroid terminal proliferation. These findings reveal an unanticipated scope of the alternative splicing program and the importance of Mbnl1 during erythroid terminal differentiation.


Figures

Figure 1
Figure 1
Alternative mRNA isoforms identified by RNA-seq analysis during the critical transition of terminal erythroid differentiation. (A) Distribution of the number of significant isoform events per genes comparing R2 with all following stages of erythropoiesis. (B) Pie chart showing the proportion of isoform changes affecting amino acid sequences in the 6 different classes of gene isoform expression events. (C) Statistically significant GO terms of genes with protein coding changes due to alternative isoforms. (D) Sashimi plots of the events showing exonic reads and junctional reads of the exon trios of the indicated SE events from (top to bottom) R2 to R5. The height of the wiggles in the exons depicts the log2 RPKM of reads covering those positions. Arcs connecting exon boundaries represent junctional reads that align the 2 connecting exons. The thickness of the arcs is proportional to the number of corresponding junctional reads. (E) Semiquantitative isoform RT-PCR analysis of splicing events in R2 proerythroblasts and late erythroblasts (R3 and R4) isolated from fetal livers at E14.5. Arrows mark the inclusion product (top band) relative to the exon-skipping product (bottom band). The bar graphs below the gel images show percentages of the included isoform (Ψ value) as quantified from the relative intensities of the inclusion and exclusion bands. (F) Quantitative RT-PCR determination of the absolute levels of expression of the inclusion and exclusion isoforms. **Significance (P < .01). N.S., nonsignificant.
Figure 2
Figure 2
Evidence for the potential role of Mbnl1 in regulating splicing during erythroid differentiation. (A) Pentamer motifs significantly enriched in the 4 flanking 250-nt intronic regions of regulated skipped exons. Rectangular boxes indicate the names of splicing factors with ≥1 known motif enriched at an FDR < 0.05. Bar graphs show the fold enrichment of the pentamer motifs. The asterisks on the gray exon trio on the left denote the location of the motifs. (B) Mbnl1 isoform expression levels during erythropoiesis. Mbnl1 transcript isoform expression level was measured by seminquantitative PCR, and Ψ values were quantified by relative intensities of the inclusion and exclusion bands. The lower bar graph shows qRT-PCR analysis of Mbnl1 inclusion and exclusion isoforms. **Significance (P < .01). (C) Western blot showing the expression the Mbnl1 inclusion and exclusion isoforms during terminal erythropoiesis; western blots of glyceraldehyde-3-phosphate dehydrogenase (GAPDH) and hemoglobin α are included as controls.
Figure 3
Figure 3
Erythroid differentiation is blocked in Mbnl1 knockdown cells and not restored by ectopic expression of the excluded isoform. (A) Western blot analysis of MBNL1 protein from GFP-sorted day 2 cultured cells following expression of shLuc, shMbnl1-1, and shMbnl1-2. GAPDH was used as loading control. (B) May-Grunwald Giemsa staining of GFP-sorted day 2 cultured cells infected with the indicated viruses. Representative images are shown. Scale bar is 10 µm. (C) Cell size measured by forward scatter at day 2 of in vitro culture shown for cells expressing shLuc control (red), shMbnl1-1 (green), and shMbnl1-2 (blue). Bar graph shows the relative forward scatter level of cells treated with the shLuc or shMbnl1 shRNAs. Statistics from 3 experiments are shown. (D) Flow cytometry plots of day 2 in vitro cultured cells stained with Ter119-APC and Hoechst. Boxes denote enucleated cells. Statistics from 3 experiments are shown. (E) RNA expression levels of the indicated genes in GFP-sorted day 2 cultured cells following addition of shRNAs, as determined by qRT PCR. 18s rRNA was used for normalization. Error bar is standard deviation (n = 3). (F) Relative hemoglobin levels in GFP-sorted day 2 cultured cells following addition of the indicated shRNAs (n = 3). (G) Western blot analysis of Mbnl1 subcellular localization in E14.5 murine fetal liver cells. GAPDH and hemoglobin α served as markers for the cytoplasmic fraction, whereas histone 2A.x served as marker for the nuclear fraction. (H) qPCR analysis of the expression levels of the Mbnl1 inclusion and exclusion isoforms after knockdown of the Mbnl1 inclusion isoform. (I) Terminal proliferation of erythroid cells after knockdown of the Mbnl1 inclusion isoform. (J) Cell size of erythroid cells measured by forward scatter after knockdown of the Mbnl1 inclusion and exclusion isoforms. (K) Enucleation of erythroid cells after knockdown of the Mbnl1inclusion and excluded isoforms. (L) qPCR analysis of the expression levels of splicing isoforms of 4 genes after knockdown of the Mbnl1 inclusion and exclusion isoforms. (M) qPCR analysis of the expression levels of the Mbnl1 inclusion and exclusion isoforms after knockdown of the Mbnl1inclusion isoform with or without ectopic expression of the Mbnl1 exclusion isoform. (N) Cell size, (O) enucleation, and (P) qPCR analysis of the expression levels of splicing isoforms of 4 genes of erythroid cells after knockdown of the Mbnl1inclusion isoform with or without ectopic expression of the Mbnl1 exclusion isoform.
Figure 4
Figure 4
Ndel1 is a direct MBNL1 splicing target. (A) Semiquantitative RT-PCR analysis of alternative exon presence in Ndel1, Mff, Picalm, and Uso1 gene transcripts in GFP-sorted cultured day1 (D1) and day 2 (D2) cells infected with shLuc (C) or shMbnl1-1 (KD). Bar graphs show the percentage of the inclusion isoform based on quantification of inclusion and exclusion band intensities. (B) Genome tracks showing the computed positions of MBNL1 binding clusters in the introns of the Mff and Picalm transcripts relative to the alternatively skipped exon. (C) Genome track showing the computed position of the MBNL1 binding clusters on the introns of Ndel1 SE event and the regions probed by the RIP experiment. (D) Western blot of MBNL1 protein in control IgG and anti-MBNL1 immunoprecipitations of a total cell lysate. (E) PCR analysis of Ndel1 intronic regions in IgG and MBNL1 immunoprecipitated cell lysates. (F) Schematic of the bichromatic splicing reporter assay; wild-type Ndel gene depicted on the left and the form with a mutation in the predicted Mbnl1 binding site on the right. (G) Fluorescent microscopy images of MBNL1-Ndel1-minigene reporter assay. (H) Quantification of the fold induction of Ndel1-inc-dsRed reporter signal derived from FACS analysis.
Figure 5
Figure 5
Knockdown of Ndel1 impairs terminal erythroid proliferation and differentiation and is partially rescued by overexpression of the Ndel1 inclusive form. (A) qRT-PCR analysis of Ndel1 expression after 48 hours of differentiation of cells expressing shLuc, shNdel1-1, shNdel1-2, or shNdel1-3. (B) Graph showing terminal proliferation of erythroid cells after knockdown of control (black), shNdel1-1 (red), shNdel1-2 (green), or shNdel1-3 (blue). (C) Representative images of May-Grunwald Giemsa staining of infected erythroid cells after 48-hour culture. Scale bar is 10 µm. (D) Flow cytometry plots of infected erythroid cells after 48-hour culture stained with Ter119-APC and Hoechst. Enucleated reticulocytes are boxed. Statistics of 3 experiments are shown. (E) qRT-PCR analysis of the expression of the Ndel1 exclusion and inclusion forms in cells in which Ndel1 is knocked down and then rescued by expression of the 2 Ndel1 isoforms. Exc., excluded; Inc., included isoform. (F) Overexpression of Ndel1-inc isoform, but not the Ndel1-exc isoform, partially rescues the proliferation defect caused by knockdown of endogenous Ndel1.

Comment in

References

    1. Chateauvieux S, Grigorakaki C, Morceau F, Dicato M, Diederich M. Erythropoietin, erythropoiesis and beyond. Biochem Pharmacol. 2011;82(10):1291–1303. - PubMed
    1. Hattangadi SM, Wong P, Zhang L, Flygare J, Lodish HF. From stem cell to red cell: regulation of erythropoiesis at multiple levels by multiple proteins, RNAs, and chromatin modifications. Blood. 2011;118(24):6258–6268. - PMC - PubMed
    1. Visconte V, Makishima H, Jankowska A, et al. SF3B1, a splicing factor is frequently mutated in refractory anemia with ring sideroblasts. Leukemia. 2012;26(3):542–545. - PubMed
    1. Papaemmanuil E, Cazzola M, Boultwood J, et al. Chronic Myeloid Disorders Working Group of the International Cancer Genome Consortium. Somatic SF3B1 mutation in myelodysplasia with ring sideroblasts. N Engl J Med. 2011;365(15):1384–1395. - PMC - PubMed
    1. Malcovati L, Papaemmanuil E, Bowen DT, et al. Chronic Myeloid Disorders Working Group of the International Cancer Genome Consortium and of the Associazione Italiana per la Ricerca sul Cancro Gruppo Italiano Malattie Mieloproliferative. Clinical significance of SF3B1 mutations in myelodysplastic syndromes and myelodysplastic/myeloproliferative neoplasms. Blood. 2011;118(24):6239–6246. - PMC - PubMed

Publication types

MeSH terms