. 2014 Aug 1;25(15):2291-304.
doi: 10.1091/mbc.E14-03-0825. Epub 2014 May 28.

Role of TGF-β receptor III localization in polarity and breast cancer progression

Affiliations

Role of TGF-β receptor III localization in polarity and breast cancer progression

Alison E Meyer et al. Mol Biol Cell. .

Abstract

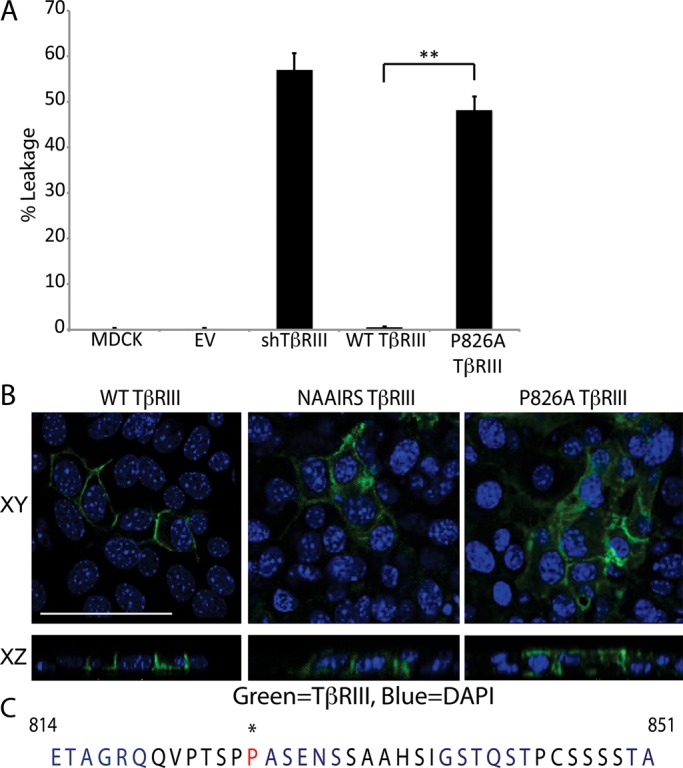
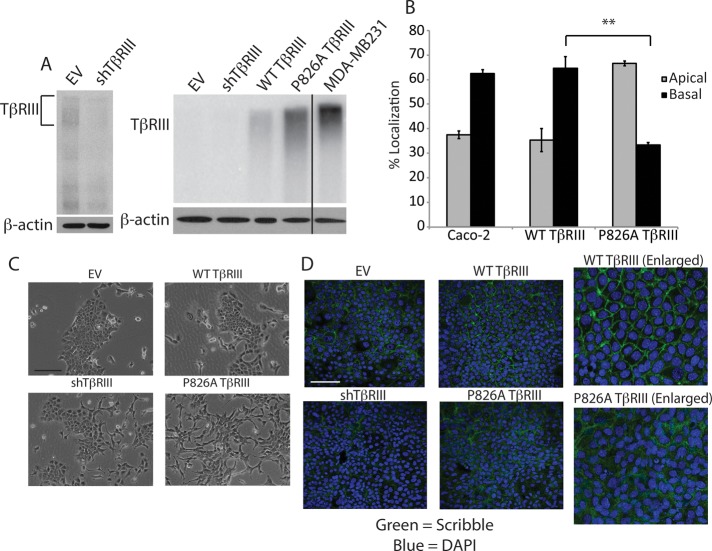
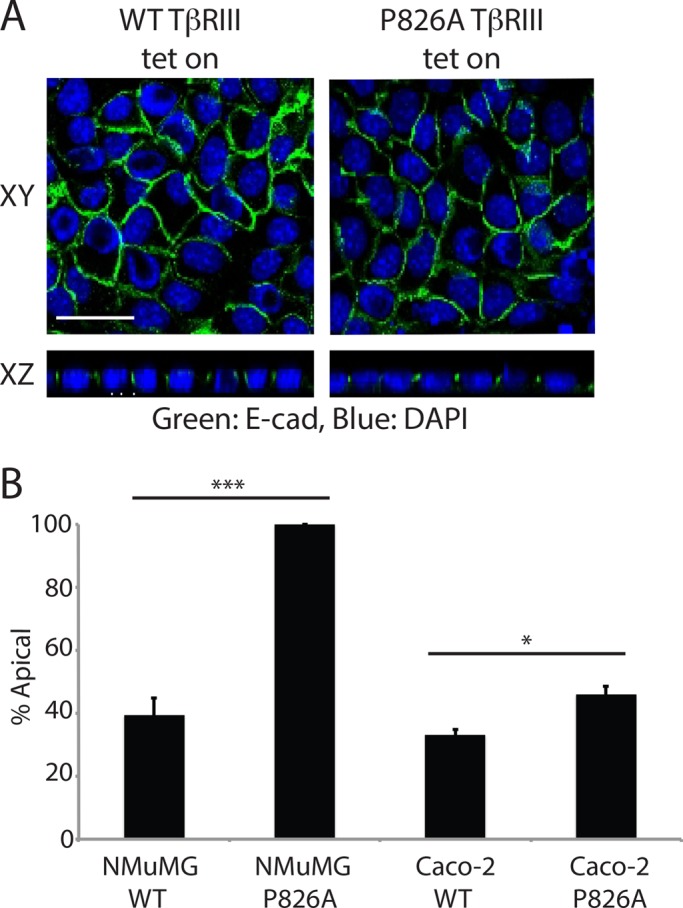
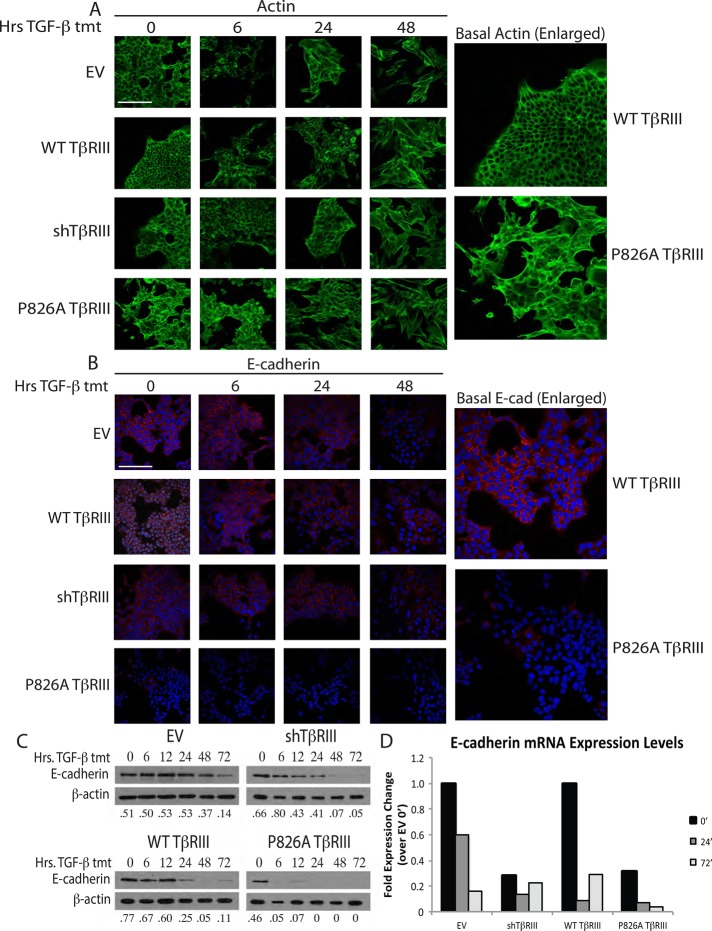
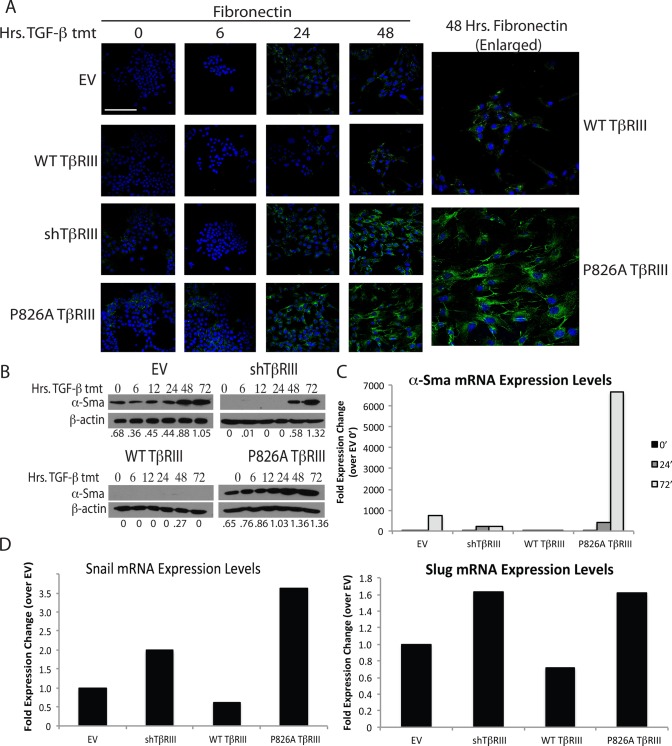
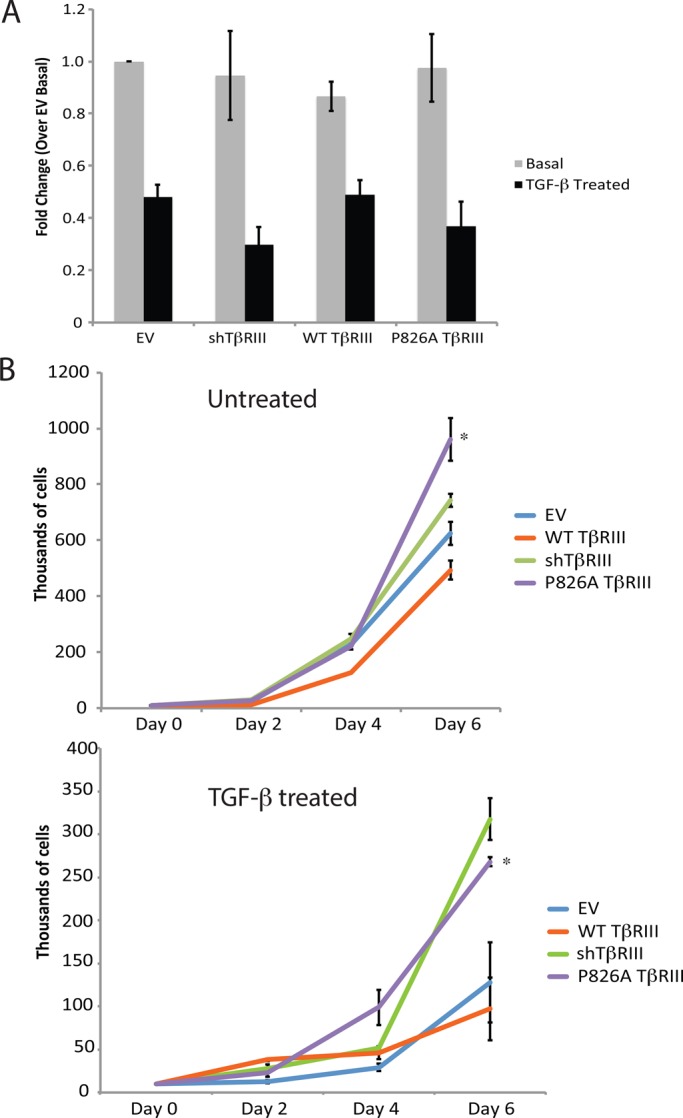
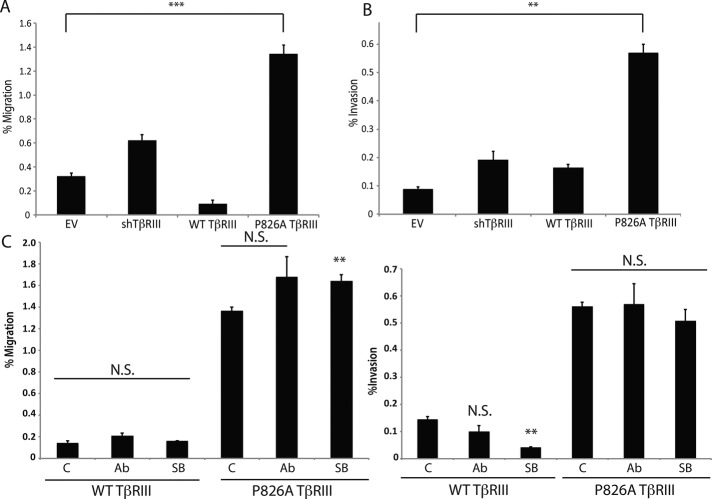
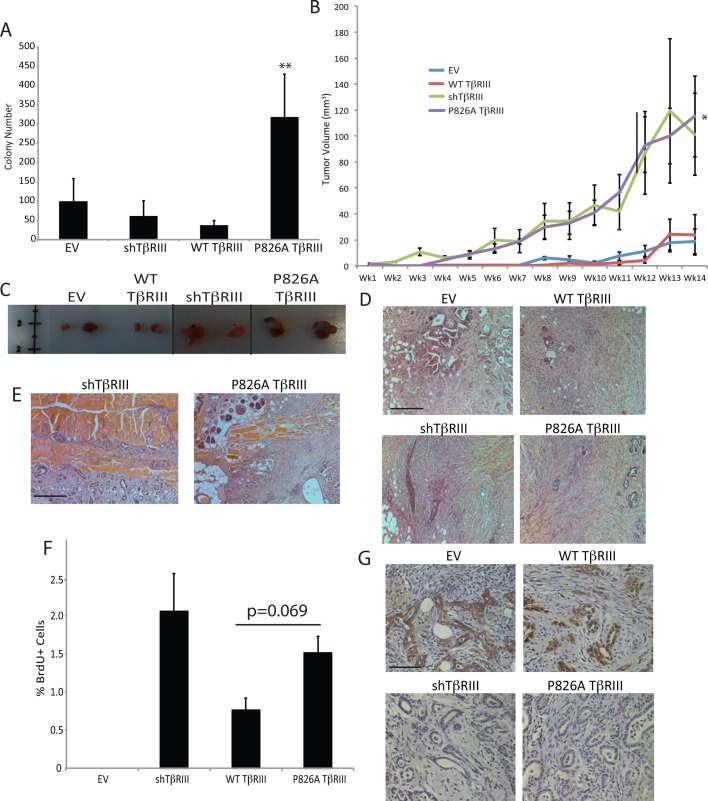
The majority of breast cancers originate from the highly polarized luminal epithelial cells lining the breast ducts. However, cell polarity is often lost during breast cancer progression. The type III transforming growth factor-β cell surface receptor (TβRIII) functions as a suppressor of breast cancer progression and also regulates the process of epithelial-to-mesenchymal transition (EMT), a consequence of which is the loss of cell polarity. Many cell surface proteins exhibit polarized expression, being targeted specifically to the apical or basolateral domains. Here we demonstrate that TβRIII is basolaterally localized in polarized breast epithelial cells and that disruption of the basolateral targeting of TβRIII through a single amino acid mutation of proline 826 in the cytosolic domain results in global loss of cell polarity through enhanced EMT. In addition, the mistargeting of TβRIII results in enhanced proliferation, migration, and invasion in vitro and enhanced tumor formation and invasion in an in vivo mouse model of breast carcinoma. These results suggest that proper localization of TβRIII is critical for maintenance of epithelial cell polarity and phenotype and expand the mechanisms by which TβRIII prevents breast cancer initiation and progression.


Figures

FIGURE 1
FIGURE 1
TβRIII is basolaterally localized. (A) We plated 2.5 × 10⁵ NMuMG or MDCK cells on Transwells and grew them for 5 d to allow for polarization. A FITC-dextran tracer was placed in the upper chamber, and the cells were incubated at room temperature for 30 min. Apical and basolateral media samples were excited at a wavelength of 490 nm, and the absorbance at 520 nm was measured. Percentage leakage = basolateral signal/apical signal × 100. **p < 0.01 (Student's t test). (B) Cells were plated as in A and transfected with WT TβRIII, NAAIRS mutant TβRIII, or P826A TβRIII. Two days posttransfection, the cells were fixed and stained with primary antibody against TβRIII and an Alexa 488 secondary (green). Nuclei (blue) were stained with DAPI. Images were collected at a magnification of 400× and show the localization of TβRIII to cell junctions in the flat sections (XY, top). The cross-sectional images (XZ, bottom) show the basolateral localization of WT TβRIII and the apical–basolateral localization of NAAIRS and P826A TβRIII. Bar, 25 μm. (B) The 42–amino acid sequence of the C-terminus of human TβRIII. Each 6–amino acid–long group altered via NAAIRS mutagenesis is shown in alternating blue and black. Residue P826, which is critical for TβRIII's basolateral localization, is starred and shown in red.
FIGURE 2
FIGURE 2
P826A TβRIII expression results in a loss of cell polarity. (A) Left, binding and cross-linking of surface TβRIII showing a lower level of TβRIII in the stable shTβRIII cells compared with the EV cells. β-Actin Western blotting was used as a loading control. Right, binding and cross-linking, showing the relative surface levels of TβRIII in the EV and shTβRIII lines, as well as in the WT TβRIII and P826A TβRIII rescued lines. The endogenous TβRIII level in the MDA-MB-231 breast cancer cell line is shown for comparison. Note that with this lighter exposure, the EV and shTβRIII signals are not observable. (B) Caco-2 and NMuMG WT and P826A TβRIII cells were grown in Transwells for 5 d. Cells were incubated with fresh medium on the apical and basal sides for a further 24 h. Media were collected, and the level of shed TβRIII in each compartment was detected via ELISA. The percentage of signal in the apical vs. basolateral chamber was calculated and graphed. **p < 0.01 (Student's t test). (C) Light images taken at 100× magnification show the morphological differences between the cell lines. Bar, 200 μm. (D) Cells were grown on coverslips to confluency, allowed to polarize for 5 d, and fixed and stained with an anti-Scribble primary antibody, followed by an Alexa 488–labeled secondary antibody (green). Nuclei were stained with DAPI (blue). Images were obtained at 400× magnification. Right, enlarged images. Bar, 200 μm.
FIGURE 3
FIGURE 3
P826A TβRIII is mistargeted. (A) Tet-inducible NMuMG WT and P826A TβRIII cells were grown on Transwells for 5 d. Cells were treated with 1.5 μg/ml doxycycline for 12 h and fixed and stained with an anti-TβRIII primary antibody, followed by an Alexa 488–labeled secondary (green). Nuclei were stained with DAPI (blue). Images were taken at a magnification of 400× and are shown as flat sections (XY) above cross-sectional images (XZ). Bar, 25 μm. (B) The apical and basal media were collected from Tet-induced NMuMG and Caco-2 Tet-inducible cells and analyzed for soluble TβRIII by ELISA. The percentage of signal in the apical vs. basolateral chamber was calculated, and the percentage of signal in the apical chamber was graphed. ***p < 0.001, *p < 0.05 (Student's t test).
FIGURE 4
FIGURE 4
P826A TβRIII cells have reduced epithelial marker expression. (A) Cells were grown on coverslips and treated with 100 pM TGF-β1 for 0, 6, 24, or 48 h. Cells were subsequently stained with Alexa 488–conjugated phalloidin for visualization of actin (green). Enlarged images show the basal difference between actin staining in the WT and P826A TβRIII cells. Bar, 200 μm. (B) Cells were grown and treated as in A and stained with a primary antibody against E-cadherin, followed by an Alexa 594–conjugated secondary antibody (red). Nuclei were stained with DAPI (blue). Enlarged images show the basal difference in E-cadherin staining between WT and P826A TβRIII cells. All images were taken at 400× magnification. Bar, 200 μm. (C) Cells were grown in six-well dishes and treated with 100 pM TGF-β1 for 0, 6, 12, 24, 48, or 72 h. Cell lysates were analyzed by Western blotting for the epithelial marker E-cadherin. β-Actin was used as a loading control. The ratios of E-cadherin to actin are noted beneath each lane. (D) Cells were grown in six-well format and treated with 100 pM TGF-β1 for 0, 24, and 72 h. To analyze the differences in E-cadherin mRNA levels, total RNA was harvested, and qPCR for E-cadherin was performed. A representative graph shows the fold expression change for each cell line and time of treatment in comparison to the EV 0-h time point. Data were normalized to GAPDH expression. The experiment was repeated three times.
FIGURE 5
FIGURE 5
P826A TβRIII cells have enhanced mesenchymal marker expression. (A) Cells were grown on coverslips, treated with 100 pM TGF-β1 for 0, 6, 24, or 48 h, and stained with an anti-fibronectin primary antibody, followed by an Alexa 488–conjugated secondary antibody (green). DAPI was used for nuclear staining (blue). Enlarged images show the difference in fibronectin staining between WT and P826A TβRIII cells at the 48-h time point. All images were taken at 400× magnification. Bar, 200 μm. (B) Cells were grown in six-well dishes and treated with 100 pM TGF-β1 for 0, 6, 12, 24, 48, or 72 h. Cell lysates were analyzed by Western blotting for the mesenchymal marker α-SMA. β-Actin was used as a loading control. The ratios of α-SMA to β-actin are noted beneath each lane. (C) Cells were grown in six-well dishes and treated with 100 pM TGF-β1 for 0, 24, and 72 h. To analyze the differences in α-SMA mRNA levels, total RNA was harvested, and qPCR for α-SMA was performed. A representative graph shows the fold expression change for each cell line and time of treatment in comparison to the EV 0-h time point. Data were normalized to GAPDH expression. Each experiment was repeated three times. (D) Cells were grown in six-well format and left untreated to analyze the basal levels of Snail and Slug mRNA. Total RNA was harvested, and qPCR for Snail (left) or Slug (right) was performed. The representative graphs show the fold expression change for each cell line in comparison to EV cells. Data were normalized to GAPDH expression. Each experiment was repeated a minimum of three times.
FIGURE 6
FIGURE 6
P826A TβRIII cells exhibit an enhanced rate of proliferation. (A) We plated 1 × 10⁴ cells in triplicate in 96-well format and grew them for 24 h in the absence or presence of 100 pM TGF-β1. Cells were then labeled with 1 μCi of 3H for 4 h, and the level of incorporation was measured by scintillation counting. The graph depicts the fold change for each cell line over the untreated EV cells. Data were analyzed using Student's t test. No significant differences were found within each group (treated or untreated). The experiment was repeated three times. (B) We plated 1 × 10⁴ cells in a six-well dish. Cells were grown in the presence (top) or absence (bottom) of 50 pM TGF-β1, with fresh media and TGF-β1 added every other day. Cells were trypsinized and counted 2, 4, and 6 d after plating, using a hemocytometer. Dead cells were excluded via staining with trypan blue. The graphs show the number of cells counted for each day (thousands) on the y-axis. Each cell line was plated in duplicate, and the experiments were performed three separate times. *p < 0.05 for P826A TβRIII compared with WT TβRIII cells at day 6 (Student's t test).
FIGURE 7
FIGURE 7
P826A TβRIII cells have enhanced migration and invasion. (A) We plated 25 × 103 (EV and WT TβRIII) or 15 × 103 (shTβRIII and P826A TβRIII) cells in 200 μl of serum free media and allowed them to migrate for 24 h toward 500 μl of medium containing 10% FBS. The number of migrated cells in three independent fields of view (100×) was counted for each cell line. Data are graphed as the number of migrating cells/the total plated cell number (percentage migration). (B) We plated 75 × 103 (EV and WT TβRIII) or 50 × 103 (shTβRIII and P826A TβRIII) cells in 500 μl of serum-free media and allowed them to invade for 24 h toward 600 μl of media containing 10% FBS. The number of invasive cells in three independent fields of view (100×) was counted for each cell line. Data are graphed as the number of invasive cells/the total plated cell number (percentage invasion). (C) WT and P826A TβRIII cells were plated and analyzed as in A and B, with the exception that dimethyl sulfoxide (DMSO; control [C]), 10 μg/ml TGF-β1–neutralizing antibody (Ab), or 10 μg/ml TβRI kinase inhibitor SB435142 (SB) was added to the upper chamber. N.S., not significant. ***p < 0.001, **p < 0.01, *p < 0.05 compared with DMSO (C) or EV (A,B) control (Student's t test).
FIGURE 8
FIGURE 8
P826A TβRIII cells form invasive tumors in mice. (A) For the soft colony assay, six-well dishes were coated with 0.8% agar, and 1 × 10⁵ NMuMG cells in 0.4% agar were plated on top. Cells were plated in triplicate and were grown for 4 wk. The number of colonies per well was determined using crystal violet staining. Data were analyzed for significance by Student's t test. The p value for P826A TβRIII vs. WT TβRIII cells is indicated. (B) We injected 1 × 10⁶ cells into the right #4 mammary gland of 6-wk-old female athymic nude mice. Tumors were measured with calipers weekly for a total of 14 wk. Tumor volume was calculated using volume = length × (width2) × 0.5. Ten mice were analyzed for each cell line. *p < 0.05 for P826A TβRIII mice compared with EV mice (Mann–Whitney test). (C) Primary tumors were excised and are shown to demonstrate size differences. The black lines indicate intervening samples that were removed for clarity. (D) Photos taken at 100× magnification show the overall tumor morphology as moderately to poorly differentiated and stroma rich. Bar, 400 μm. (E) Representative images (100×) showing localized invasion of the tumor into the muscle wall in an shTβRIII and a P826A TβRIII sample. Bar, 400 μm. (F) IHC was performed to detect incorporated BrdU. The percentage of BrdU-positive cells per field of view (100×) was determined for each cell line. No BrdU+ cells were observed in the single EV sample that was large enough for analysis. N = 3 for WT TβRIII, N = 8 for shTβRIII, and N = 10 for P826A TβRIII. Data were analyzed by the Mann–Whitney test. The p value for P826A TβRIII vs. WT TβRIII cells is noted above the graph. (G) Tumor sections were stained for E-cadherin (brown), which was absent from P826A and shTβRIII tumors but present around ductal structures in EV and WT TβRIII tumors (images are at 400× magnification). Bar, 100 μm.

References

    1. Aigner K, et al. The transcription factor ZEB1 (deltaEF1) promotes tumour cell dedifferentiation by repressing master regulators of epithelial cell polarity. Oncogene. 2007;26:6979–6988. - PMC - PubMed
    1. Aroeti B, Okhrimenko H, Reich V, Orzech E. Polarized trafficking of plasma membrane proteins: emerging roles for coats, SNAREs, GTPases and their link to the cytoskeleton. Biochim Biophys Acta. 1998;1376:57–90. - PubMed
    1. Balda MS, Matter K. Tight junctions and the regulation of gene expression. Biochim Biophys Acta. 2009;1788:761–767. - PubMed
    1. Batlle E, Sancho E, Franci C, Dominguez D, Monfar M, Baulida J, Gracia De Herreros A. The transcription factor snail is a repressor of E-cadherin gene expression in epithelial tumour cells. Nat Cell Biol. 2000;2:84–89. - PubMed
    1. Bazellieres E, Assemat E, Arsanto JP, Le Bivic A, Massey-Harroche D. Crumbs proteins in epithelial morphogenesis. Front Biosci (Landmark Ed) 2009;14:2149–2169. - PubMed

Publication types

MeSH terms

Substances

LinkOut - more resources