. 2014 Jun 12;510(7504):235-240.
doi: 10.1038/nature13420. Epub 2014 May 28.

Targeted genome editing in human repopulating haematopoietic stem cells

Affiliations

Targeted genome editing in human repopulating haematopoietic stem cells

Pietro Genovese et al. Nature. .

Abstract

Targeted genome editing by artificial nucleases has brought the goal of site-specific transgene integration and gene correction within the reach of gene therapy. However, its application to long-term repopulating haematopoietic stem cells (HSCs) has remained elusive. Here we show that poor permissiveness to gene transfer and limited proficiency of the homology-directed DNA repair pathway constrain gene targeting in human HSCs. By tailoring delivery platforms and culture conditions we overcame these barriers and provide stringent evidence of targeted integration in human HSCs by long-term multilineage repopulation of transplanted mice. We demonstrate the therapeutic potential of our strategy by targeting a corrective complementary DNA into the IL2RG gene of HSCs from healthy donors and a subject with X-linked severe combined immunodeficiency (SCID-X1). Gene-edited HSCs sustained normal haematopoiesis and gave rise to functional lymphoid cells that possess a selective growth advantage over those carrying disruptive IL2RG mutations. These results open up new avenues for treating SCID-X1 and other diseases.


Figures

Figure 1
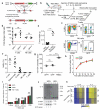
Figure 1. Targeted integration into AAVS1 or IL2RG in CB CD34+ cells
a, Schematic of the donor IDLV template containing a GFP cassette driven by the phosphoglycerate kinase promoter (PGK) flanked by sequences homologous to the genomic target locus, the target locus with the ZFNs cleavage site and the locus after HDR showing the PCR primers used to assess 5′ or 3′ HDR-mediated integration junctions (black arrows). b, Flow chart for targeted integration (TI) and cell analyses. c, Representative flow cytometry dot plots (Top) and percentages of GFP+ cells and NHEJ-induced indels at the target locus (Bottom) of CB CD34+ cells treated for TI into AAVS1 or IL2RG. Means ± SEM (AAVS1, n=39 on 19 CB donors; IL2RG, n=10 on 9 CB donors). Unrelated donor: cells treated with IDLV lacking homology to the target site. nd: not detectable, np: not performed. d, Targeting specificity in CFC. Percentage of colonies positive for both (HDR), either (HDR+NHEJ) or none (Unknown) 5′ and 3′ HDR junctions by PCR. Numbers of colonies screened indicated inside the bars. e, Southern blot (top) and PCR (bottom) analyses of iPSC obtained by reprogramming GFP+ or GFP− cells from (c).
Figure 2
Figure 2. Transplantation of gene targeted CD34+ cells in NSG mice
CD34+ cells treated as in Fig.1b were transplanted into NSG mice. a, (Left) Human cell engraftment (CD45+) 12-23 weeks post-transplant in the indicated organs. (Right) Percentages of the indicated lineages within the human graft. Data from individual mice and mean ± SEM (n=42 mice; 6 independent experiments on 13 CB donors). b, Time course of human GFP+ cells in PB of mice. Dashed lines: mice in which GFP+ cells were no longer detectable (<0.1%) 12 weeks post-transplant. c, GFP+ cells within the human graft in the indicated organs (Left) and lineages (Right). (n=18). d, GFP+ cells within human primitive (CD34+CD38−) or committed (CD34+CD38+) progenitors or differentiated cells (CD34-CD38+) in mouse BM. e, PCR analysis for TI into AAVS1 on human lymphoid (CD19+) and myeloid (CD33+ and CD13+) cells sorted from the mice and on GFP+ CFC from mouse BM. f, Representative images of GFP+ colonies. Scale bars, 0.5 mm. g, NHEJ at AAVS1 or IL2RG ZFNs target sites on total BM cells from (a). n= 25, 3 independent experiments.
Figure 3
Figure 3. Gene targeting in primitive versus committed progenitors
a, GFP+ cells within the indicated subpopulations 3 days after treatment for TI. The left most panel shows results using the protocol described in Fig.1b. The other panels show the effect of longer prestimulation and/or addition of the indicated drugs, as shown in the schematic in (b). Means ± SEM (n=31,15,14,15,7,5 respectively on 37 total CB donors). *p< 0.05; ***p< 0.001 (one-way Anova). c, Composition of CD34+ cells cultured with or without SR1; subpopulations as in (a) . Means ± SEM (n=4). d, Total (left) and GFP+ (right) colonies from CD34+ cells treated for TI with or without SR1. Means ± SEM (n=20, 14). e, Yield of GFP+ early progenitors relative to that obtained using the original protocol of Fig.1b. Means ± SEM (n=8,7,11,10,3,5) **p<0.01 (one-way Anova). f, Percentage of NSG mice harboring GFP+ cells 14 weeks after transplant of CD34+ cells treated with the indicated TI protocols. g, Time course of human engraftment in PB. Means ± SEM (24h SR1, n=5; 48h SR1, n=6; 48h, n=5) ****p<0.0001, ***p<0.001 (two-way Anova). h, GFP+ cells within CD45+ cells in PB 14 weeks post-transplant. Means ± SEM (n=4). Mice for the 24h SR1- condition are shown for comparison from Fig.2c.
Figure 4
Figure 4. Functional reconstitution of IL2RG in the lymphoid progeny of HSC
a, Schematic of the IL2RG donor: a promoter-less IL2RG cDNA, comprising exons 5-8 plus 3′ untranslated region (UTR), and a PGK-GFP cassette are flanked by homologous sequences to those surrounding the IL2RG ZFNs target site. b, Flow chart of cell transplantation, tumor challenge and analyses. c, Density plots of γ-chain expressing T (Top) and NK (Bottom) cells showing GFP marking. (n=7,11). d, Expansion of GFP− and GFP+ T and NK cells after tumor challeng. e, Tumor weight 3 weeks after challenge, in mice transplanted (n=16) or not (n=3). ****p<0.0001 (unpaired t test). f, NHEJ in the IL2RG gene on CD34+ cells cultured in vitro and on their progeny sorted from the transplanted mice. g, TCR complexity score calculated on GFP+ or GFP− T cells from transplanted mice. Human PB mononuclear cells (PBMCs) were used as positive control. ****p<0.0001 (one-way Anova). h, Ex vivo growth of GFP+ and GFP− T cells from the spleen of transplanted mice upon stimulation (n= 4). i, Division index of GFP+ or GFP− T cells 7 days after PHA stimulation or co-culture with tumor cells at the indicated effector-to-target (E/T) ratios. p=ns (unpaired t test). T cells from healthy donor (HD) were used as controls. j, Southern blot (top), PCR (middle) and GFP q-PCR (bottom) analyses showing TI of the corrective IL2RG cDNA in sorted GFP+ T cells from (h). UT: untreated cells. k, Heatmap showing changes in phosphorylation levels of STAT5 after the indicated time of exposure to decreasing amounts of IL-2 or IL-15, on T cells from (h). p=ns (two-way Anova).
Figure 5
Figure 5. Targeted integration and IL2RG gene correction in BM-derived CD34+ cells from healthy donors and a subject with SCID-X1
a, (Top) GFP+ cells within the indicated subpopulations derived from BM CD34+ cells of adult healthy donors, treated for TI according to the best performing protocol from Fig. 3. (Bottom) NHEJ at the ZFN target site on total cells. Means ± SEM, (n=10,3 from 4,3 donors for AAVS1 or IL2RG, respectively) b, (Top left) Human cells in PB of NSG mice transplanted with cells from (a). (Top right) Percentages of the indicated lineages within human cells 15 weeks post-transplant. (Bottom) GFP+ cells within the indicated populations. c, GFP+ cells measured as in (a) in BM CD34+ cells from a subject with SCID-X1 treated for IL2RG gene correction. d, IL2RG expression on myeloid (CD33+) cells from a GFP+ colony from the cells treated in (c) or from pooled wild type colonies. e, PCR analysis for TI into IL2RG of the corrective cDNA on cells from (c) and (d). f, Expression of the fusion transcript bearing the corrective IL2RG cDNA measured by Q-PCR (top) or RT-PCR (bottom) on cDNA from a GFP+ SCID-X1 myeloid colony. IL2RG targeted T cells from engrafted mice analyzed in Fig. 4j were used as positive control, while a myeloid colony from wild-type BM cells (WT) and PBMCs were used as negative controls.

Comment in

  • Gene therapy: Repair and replace.
    Fischer A. Fischer A. Nature. 2014 Jun 12;510(7504):226-7. doi: 10.1038/nature13344. Epub 2014 May 28. Nature. 2014. PMID: 24870243 No abstract available.

References

References of the main text

    1. Mukherjee S, Thrasher AJ. Gene therapy for PIDs: progress, pitfalls and prospects. Gene. 2013;525:174–181. doi:10.1016/j.gene.2013.03.098. - PMC - PubMed
    1. Aiuti A, et al. Lentiviral Hematopoietic Stem Cell Gene Therapy in Patients with Wiskott-Aldrich Syndrome. Science. 2013;341:1233151. doi:10.1126/science.1233151. - PMC - PubMed
    1. Cavazzana-Calvo M, et al. Transfusion independence and HMGA2 activation after gene therapy of human beta-thalassaemia. Nature. 2010;467:318–322. doi:10.1038/nature09328. - PMC - PubMed
    1. Cartier N, et al. Hematopoietic stem cell gene therapy with a lentiviral vector in X-linked adrenoleukodystrophy. Science. 2009;326:818–823. - PubMed
    1. Biffi A, et al. Lentiviral Hematopoietic Stem Cell Gene Therapy Benefits Metachromatic Leukodystrophy. Science. 2013;341:1233158. doi:10.1126/science.1233158. - PubMed

Additional References

    1. Matrai J, et al. Hepatocyte-targeted expression by integrase-defective lentiviral vectors induces antigen-specific tolerance in mice with low genotoxic risk. Hepatology. 2011;53:1696–1707. doi:10.1002/hep.24230. - PMC - PubMed
    1. Hockemeyer D, et al. Efficient targeting of expressed and silent genes in human ESCs and iPSCs using zinc-finger nucleases. Nat Biotechnol. 2009;27:851–857. doi:10.1038/nbt.1562. - PMC - PubMed
    1. Miller JC, et al. An improved zinc-finger nuclease architecture for highly specific genome editing. Nat Biotechnol. 2007;25:778–785. - PubMed
    1. Akatsuka Y, Martin EG, Madonik A, Barsoukov AA, Hansen JA. Rapid screening of T-cell receptor (TCR) variable gene usage by multiplex PCR: application for assessment of clonal composition. Tissue Antigens. 1999;53:122–134. - PubMed
    1. Wu CJ, et al. Reconstitution of T-cell receptor repertoire diversity following T-cell depleted allogeneic bone marrow transplantation is related to hematopoietic chimerism. Blood. 2000;95:352–359. - PubMed

Publication types

MeSH terms