. 2014 Jun 5;510(7503):103-8.
doi: 10.1038/nature13404. Epub 2014 May 25.

Accurate design of co-assembling multi-component protein nanomaterials

Affiliations

Accurate design of co-assembling multi-component protein nanomaterials

Neil P King et al. Nature. .

Abstract

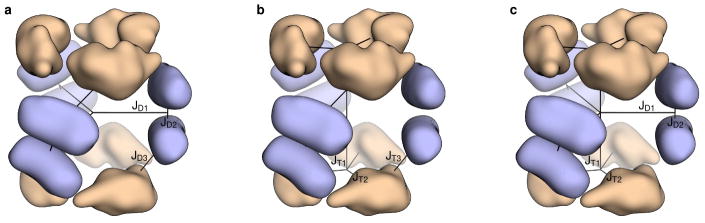
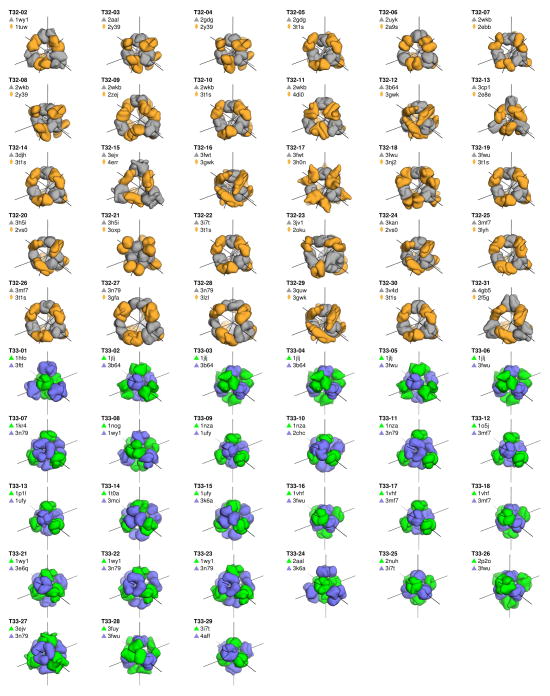
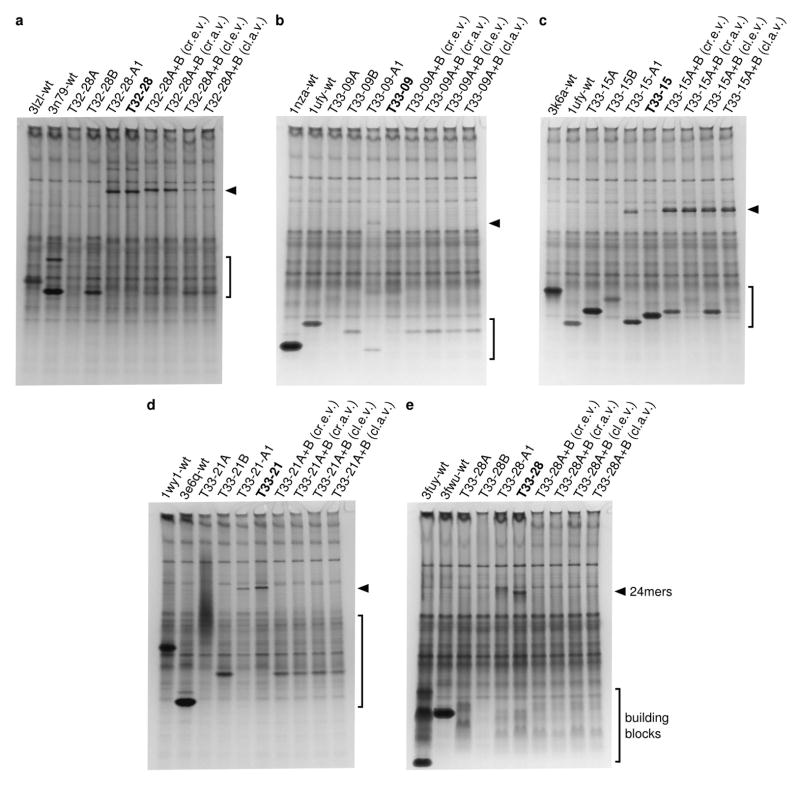
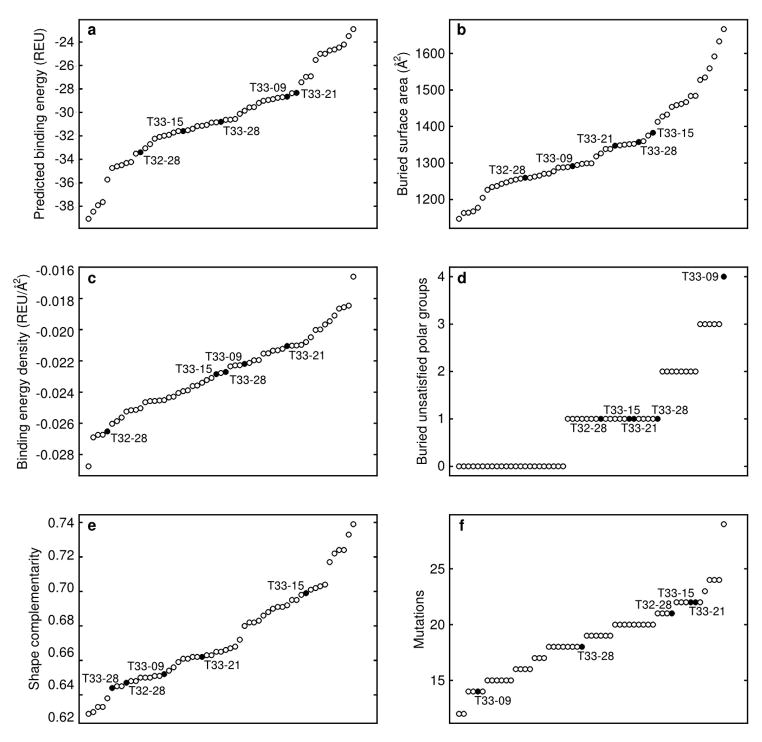
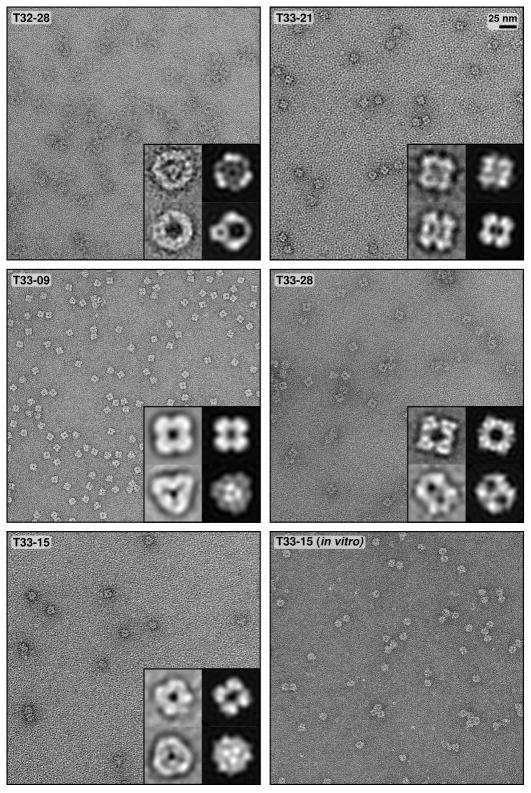
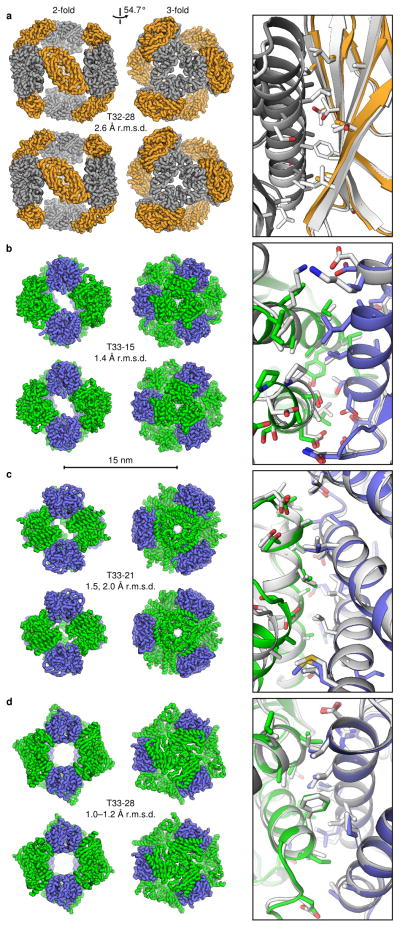
The self-assembly of proteins into highly ordered nanoscale architectures is a hallmark of biological systems. The sophisticated functions of these molecular machines have inspired the development of methods to engineer self-assembling protein nanostructures; however, the design of multi-component protein nanomaterials with high accuracy remains an outstanding challenge. Here we report a computational method for designing protein nanomaterials in which multiple copies of two distinct subunits co-assemble into a specific architecture. We use the method to design five 24-subunit cage-like protein nanomaterials in two distinct symmetric architectures and experimentally demonstrate that their structures are in close agreement with the computational design models. The accuracy of the method and the number and variety of two-component materials that it makes accessible suggest a route to the construction of functional protein nanomaterials tailored to specific applications.


Conflict of interest statement

The authors declare no competing financial interests.

Figures

Extended Data Figure 1
Extended Data Figure 1. Comparison of one-component and multi-component symmetric fold trees
Three different symmetric fold tree representations of a D32 architecture are shown. In this architecture, two trimeric building blocks (wheat) are aligned along the three-fold rotational axes of D3 point group symmetry and three dimeric building blocks (light blue) are aligned along the two-folds. a, The dimer-centric one-component symmetry case. Rigid body degree of freedom (RB DOF, black lines) JD3 connecting the master dimer subunit to the master trimer subunit is a child of RB DOFs JD1 and JD2 controlling the master dimer subunit; in this case the positions of the trimeric subunits depend on the positions of the dimeric subunits. b, The trimer-centric one-component symmetry case. RB DOF JT3 connecting the master trimer subunit to the master dimer subunit is a child of RB DOFs JT1 and JT2 controlling the master trimer subunit; in this case the positions of the dimeric subunits depend on the positions of the trimeric subunits. c, The multi-component symmetry case. With multi-component symmetric modeling, the RB DOFs controlling the master trimer subunit (JT1 and JT2) and the master dimer subunit (JD1 and JD2) are independent. In this case the positions of the dimeric subunits do not depend on the positions of the trimeric subunits and vice versa, allowing the internal DOFs for each building block (JT2 and JD2) to be maintained while moving the building blocks independently (JT1 and JD1). See the Supplementary Methods for additional discussion.
Extended Data Figure 2
Extended Data Figure 2. Models of the 57 designs selected for experimental characterization
Smoothed surface representations are shown of each of the 30 T32 and 27 T33 designs. The trimeric component of each T32 design is shown in grey and the dimeric component in orange. The two different trimeric components of each T33 design are shown in blue and green. The tetrahedral two-fold and three-fold symmetry axes (black lines) are shown passing through the center of each component. Each design is named according to its symmetric architecture (T32 or T33) followed by a unique identification number. The pairs of scaffold proteins from which the designs are also indicated.
Extended Data Figure 3
Extended Data Figure 3. Native PAGE analysis of cleared cell lysates
Each gel contains cleared lysates pertaining to a, T32-28, b, T33-09, c, T33-15, d, T33-21, or e, T33-28. Lane 1 is from cells expressing the wild-type scaffold for component A and lane 2 the wild-type scaffold for component B. Lanes 3–4 are from cells expressing the individual design components and lanes 5–6 the co-expressed components. Lanes 7–8 are from samples mixed as crude lysates (cr.e.v or cr.a.v), while lanes 9–10 are from samples mixed as cleared lysates (cl.e.v. or cl.a.v.). Lanes 7 and 9 are from lysates mixed with equal volumes (cr.e.v. or cl.e.v.), while lanes 8 and 10 are from lysates mixed with adjusted volumes (cr.a.v. or cl.a.v.). Lane 5 is from cells expressing the C-terminally A1-tagged constructs; all other lanes are from cells expressing the C-terminally His-tagged constructs. An arrow is positioned next to each gel indicating the migration of 24-subunit assemblies and the gel regions containing unnassembled building blocks are bracketed. Each gel was stained with GelCode Blue (Thermo Scientific). Portions of the gels in a and c are also shown in Figure 2b.
Extended Data Figure 4
Extended Data Figure 4. Structural metrics for the computational design models
Selected metrics related to the designed interfaces are plotted for the 57 designs that were experimentally characterized, including a, the predicted binding energy measured in Rosetta Energy Units (REU), b, the surface area buried by each instance of the designed interface, c, the binding energy density (calculated as the predicted binding energy divided by the buried surface area), d, the number of buried unsatisfied polar groups at the designed interface, e, the shape complementarity of the designed interface, and f, the total number of mutations in each designed pair of proteins. Each circle represents a single design; the five successful materials are plotted as filled circles and labeled. In each plot, the designs are arranged on the x axis in order of increasing value.
Extended Data Figure 5
Extended Data Figure 5. Electron micrographs of in vitro-assembled T33-15 (unpurified) and T33-15A and T33-15B in isolation
Negative stain electron micrographs of independently purified T33-15 components and unpurified, in vitro-assembled T33-15 are shown to scale (scale bar: 25 nm).
Figure 1
Figure 1. Overview of the computational design method
a, The T33 architecture comprises four copies each of two distinct trimeric building blocks (green and blue) arranged with tetrahedral point group symmetry (24 total subunits; triangles indicate three-fold symmetry axes). b, Each building block has two rigid body degrees of freedom, one translational (r) and one rotational (ω), that are systematically explored during docking. c–d, The docking procedure, which is independent of the amino acid sequence of the building blocks, identifies large interfaces with high densities of contacting residues formed by well-anchored regions of the protein structure. e, Amino acid sequences are designed at the new interface to stabilize the modeled configuration and drive coassembly of the two components. f, In the T32 architecture, four trimeric (grey) and six dimeric (orange) building blocks are aligned along the three-fold and two-fold symmetry axes passing through the vertices and edges of a tetrahedron, respectively.
Figure 2
Figure 2. Experimental characterization of coassembly
a, SEC chromatograms of the designed pairs of proteins (solid lines) and the wild-type oligomeric proteins from which they were derived (dashed and dotted lines). The co-expressed designed proteins elute at the volumes expected for the target 24-subunit nanomaterials, while the wild-type proteins elute as dimers or trimers. The T33-15 in vitro panel shows chromatograms for the individually produced and purified designed components (T33-15A and T33-15B) as well as a stoichiometric mixture of the two components. b, Native PAGE analysis of in vitro-assembled T32-28 (left panel) and T33-15 (right panel) in cell lysates. Lysates containing the co-expressed design components (lanes 5–6) contain slowly migrating species (arrows) not present in lysates containing the wild-type and individually expressed components (lanes 1–4). Mixing equal volumes (e.v.) of crude lysates containing the individual designed components yields the same assemblies (lane 7), although some unassembled building blocks remain due to unequal levels of expression (particularly for T33-15). When the differences in expression levels are accounted for by mixing adjusted volumes of lysates (a.v.), more efficient assembly is observed (lane 8).
Figure 3
Figure 3. Modeled interfaces of designed two-component protein nanomaterials
The models of the designed interfaces in each component of T32-28, T33-09, T33-15, T33-21, and T33-28 are shown at left or right, and side views of each interface as a whole are shown at center. Each image is oriented such that a vector originating at the center of the tetrahedral material and passing through the center of mass of the designed interface would pass vertically through the center of the image. The side chains of all amino acids allowed to repack and minimize during the interface design procedure are shown in stick representation. The alpha carbon atoms of positions that were mutated during design are shown as spheres, and the mutations are labeled. To highlight the morphologies of the contacting surfaces, atoms within 5 Å of the opposite building block are shown in semi-transparent surface representation. Oxygen atoms are red; nitrogen, blue; and sulfur, orange.
Figure 4
Figure 4. Electron micrographs of designed two-component protein nanomaterials
Negative stain electron micrographs for five designed materials are shown to scale (scale bar: 25 nm). The T33-15 in vitro sample was prepared by stoichiometrically mixing the independently purified components (T33-15A and T33-15B) in vitro and purifying the assembled material by SEC (see Figure 2). Micrographs of unpurified, in vitro-assembled T33-15 as well as T33-15A and T33-15B in isolation are shown in Extended Data Figure 5. For each material, two different class averages of the particles are shown in the insets (left) alongside back projections calculated from the computational design models (right).
Figure 5
Figure 5. Crystal structures of designed two-component protein nanomaterials
The computational design models (top) and X-ray crystal structures (bottom) are shown at left for a, T32-28, b, T33-15, c, T33-21, and d, T33-28. Views of each material are shown to scale along the 2-fold and 3-fold tetrahedral symmetry axes (scale bar: 15 nm). The r.m.s.d. values given are those between the backbone atoms in all 24 chains of the design models and crystal structures. For T33-21, r.m.s.d. values are shown for both crystal forms (images are shown for the higher resolution crystal form with backbone r.m.s.d. 2.0 Å), while the r.m.s.d. range for T33-28 derives from the four copies of the fully assembled material in the crystallographic asymmetric unit. At right, overlays of the designed interfaces in the design models (white) and crystal structures (grey, orange, green, and blue) are shown. Due to the limited resolution of the T32-28 structure, the amino acid side chains were not modeled beyond the beta carbon. For the interface overlays, the crystal structures were aligned to the design models using the backbone atoms of two subunits, one of each component.

Similar articles

Cited by

References

    1. Howorka S. Rationally engineering natural protein assemblies in nanobiotechnology. Curr Opin Biotechnol. 2011;22:485–491. - PubMed
    1. Douglas T, Young M. Viruses: making friends with old foes. Science. 2006;312:873–875. - PubMed
    1. Lai YT, King NP, Yeates TO. Principles for designing ordered protein assemblies. Trends Cell Biol. 2012;22:653–661. - PubMed
    1. King NP, Lai YT. Practical approaches to designing novel protein assemblies. Curr Opin Struct Biol. 2013;23:632–638. - PubMed
    1. Sinclair JC. Constructing arrays of proteins. Curr Opin Chem Biol. 2013;17:946–951. - PubMed

Publication types