

Parenclitic networks: uncovering new functions in biological data
- PMID: 24870931
- PMCID: PMC4037713
- DOI: 10.1038/srep05112
Parenclitic networks: uncovering new functions in biological data
Abstract
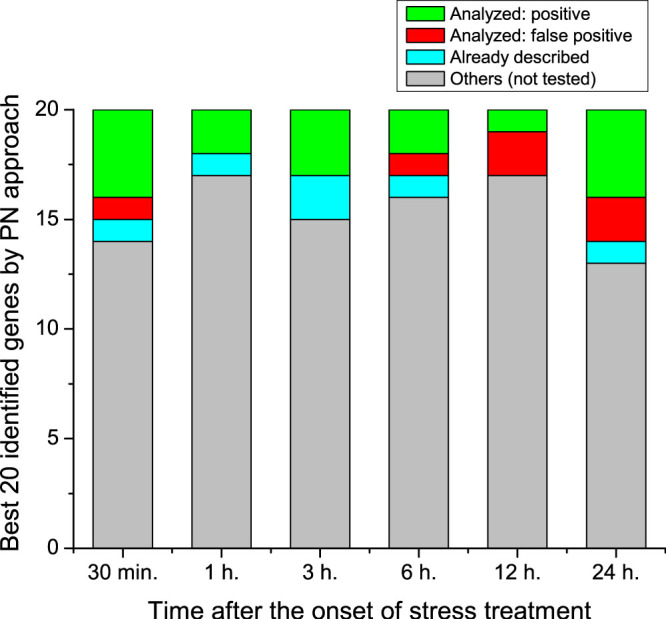
We introduce a novel method to represent time independent, scalar data sets as complex networks. We apply our method to investigate gene expression in the response to osmotic stress of Arabidopsis thaliana. In the proposed network representation, the most important genes for the plant response turn out to be the nodes with highest centrality in appropriately reconstructed networks. We also performed a target experiment, in which the predicted genes were artificially induced one by one, and the growth of the corresponding phenotypes compared to that of the wild-type. The joint application of the network reconstruction method and of the in vivo experiments allowed identifying 15 previously unknown key genes, and provided models of their mutual relationships. This novel representation extends the use of graph theory to data sets hitherto considered outside of the realm of its application, vastly simplifying the characterization of their underlying structure.
Figures
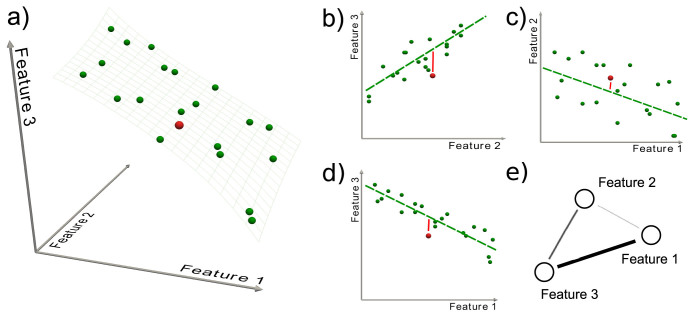
 of the class. A generic unlabeled system is represented by a red sphere. (b–d) Data are then projected on each of the three possible planes. The green dashed lines represent the models extracted in each plane, i.e.
 . The red points are the positions of the unlabeled system, and the red lines indicate the distance of the system from the models. (e) The resulting parenclitic representation is a network where nodes are associated to features, and links are weighted according to the calculated distances (coded, in this Figure, into different line widths).
References
-
- Albert R. & Barabási A. L. Statistical mechanics of complex networks. Rev. Mod. Phys. 74, 47–97 (2002).
-
- Boccaletti S., Latora V., Moreno Y., Chavez M. & Hwang D. Complex networks: Structure and dynamics. Phys. Rep. 424, 175–308 (2006).
-
- Barabási A. L. & Oltvai Z. N. Network biology: understanding the cell's functional organization. Nat. Rev. Gen. 5, 101–113 (2004). - PubMed
-
- Albert R., Jeong H. & Barabási A. L. Internet: Diameter of the world-wide web. Nature 401, 103–131 (1999).
Publication types
MeSH terms
LinkOut - more resources
Full Text Sources
Other Literature Sources
