. 2014 May 28;6(238):238ra70.
doi: 10.1126/scitranslmed.3008211.

Improved survival with T cell clonotype stability after anti-CTLA-4 treatment in cancer patients

Affiliations

Improved survival with T cell clonotype stability after anti-CTLA-4 treatment in cancer patients

Edward Cha et al. Sci Transl Med. .

Abstract

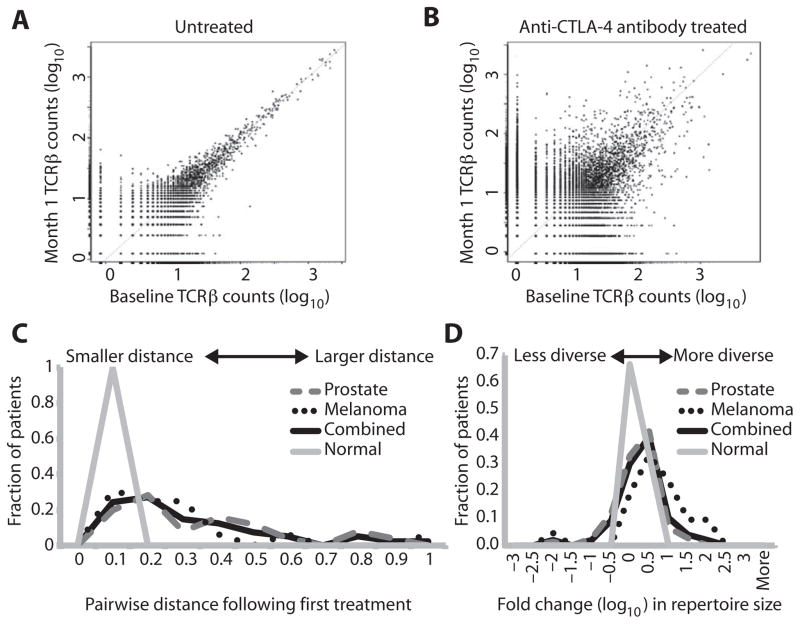
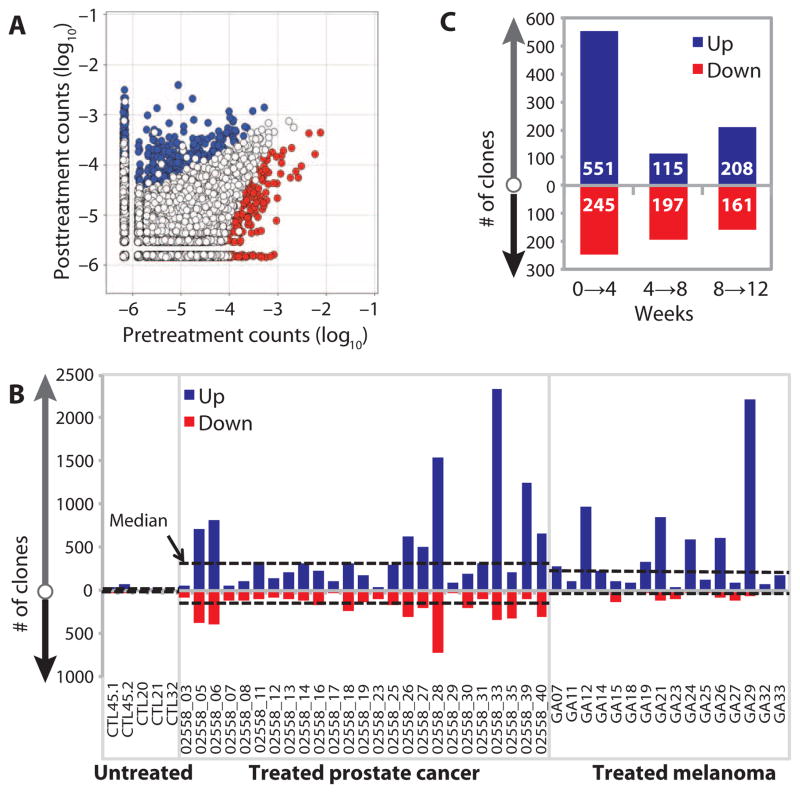
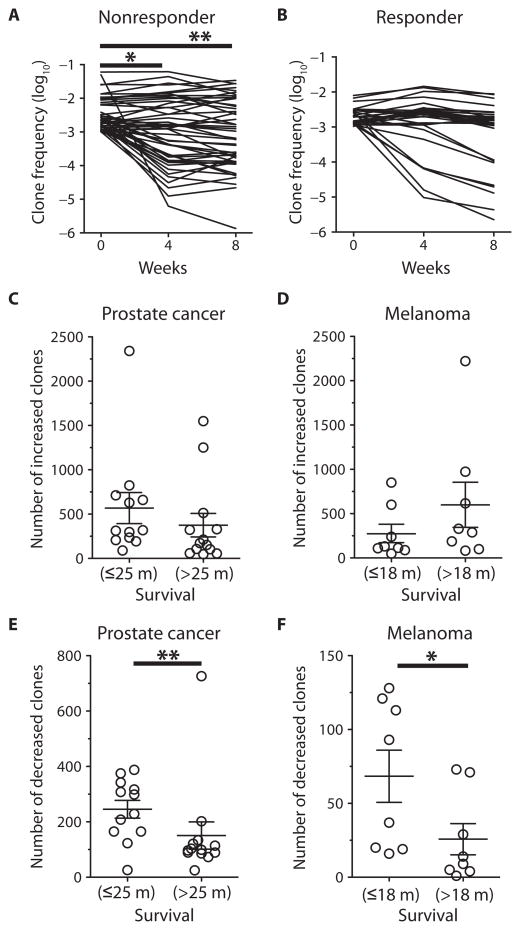
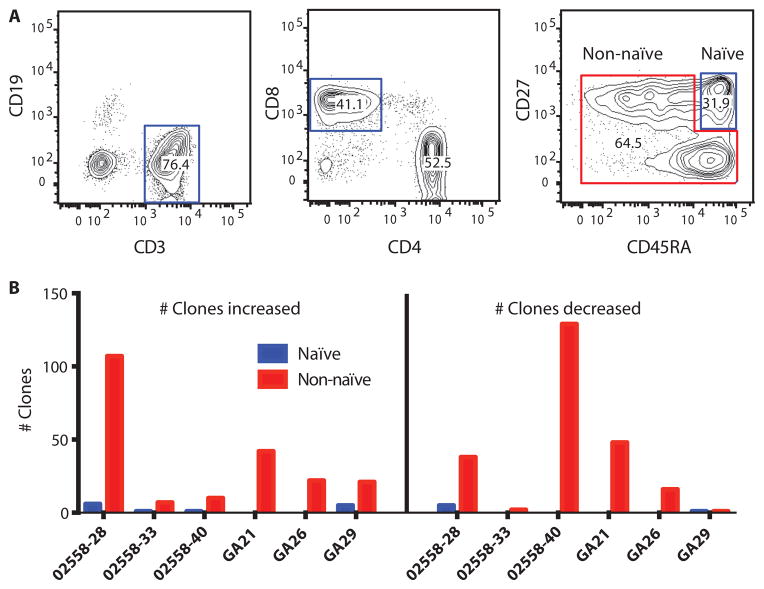
Cytotoxic T lymphocyte-associated antigen-4 (CTLA-4) blockade can promote antitumor T cell immunity and clinical responses. The mechanism by which anti-CTLA-4 antibodies induces antitumor responses is controversial. To determine the effects of CTLA-4 blockade on the T cell repertoire, we used next-generation deep sequencing to measure the frequency of individual rearranged T cell receptor β (TCRβ) genes, thereby characterizing the diversity of rearrangements, known as T cell clonotypes. CTLA-4 blockade in patients with metastatic castration-resistant prostate cancer and metastatic melanoma resulted in both expansion and loss of T cell clonotypes, consistent with a global turnover of the T cell repertoire. Overall, this treatment increased TCR diversity as reflected in the number of unique TCR clonotypes. The repertoire of clonotypes continued to evolve over subsequent months of treatment. Whereas the number of clonotypes that increased with treatment was not associated with clinical outcome, improved overall survival was associated with maintenance of high-frequency clones at baseline. In contrast, the highest-frequency clonotypes fell with treatment in patients with short overall survival. Stably maintained clonotypes included T cells having high-avidity TCR such as virus-reactive T cells. Together, these results suggest that CTLA-4 blockade induces T cell repertoire evolution and diversification. Moreover, improved clinical outcomes are associated with less clonotype loss, consistent with the maintenance of high-frequency TCR clonotypes during treatment. These clones may represent the presence of preexisting high-avidity T cells that may be relevant in the antitumor response.


Conflict of interest statement

Competing interests: M.K., C.C., and M.F. are employees of and own stock in Sequenta. Sequenta has pending patent applications on the TCR sequencing platform. E.C., Y.H., A.R., and L.F. declare that they have no competing interests.

Figures

Fig. 1
Fig. 1. Evolution of T cell repertoire with anti–CTLA-4 antibodies
(A and B) TCRβ clonotype frequency plots are depicted for a representative untreated individual (A) and for a patient treated with anti–CTLA-4 antibody (B). Each point on the scatter plots represents a single clonotype with normalized log10 clone count graphed at baseline (x axis) and after 1 month (y axis). The increased variance of the low-abundance clones is due to Poisson sampling effects. Clones that are present in only one sample are assigned an arbitrary count of 1 in the sample from which they are missing to permit plotting. (C) The difference between pre- and posttreatment samples (and untreated, sequential, normal samples) was quantified by applying Morisita’s distance to clone count distributions, with 0 indicating minimal distance, and 1 indicating maximal distance. The distribution of distance values was plotted. (D) Repertoire size (that is, sample diversity) was quantified by counting the number of unique clonotypes comprising the top 25th percentile of clones after sorting by abundance. Fold change in repertoire size was calculated, and the distribution of fold change values was plotted on a logarithmic scale.
Fig. 2
Fig. 2. Accelerated repertoire turnover with multiple anti–CTLA-4 treatments
(A) Representative frequency plot, showing the number of clones with significantly increased (blue) or decreased (red) abundance, using DESeq with a median dispersion model fitted to untreated normal samples separated by 1 month. (B) The numbers of clones with significantly changed abundance 1 month after first treatment are plotted for each sample, with increased abundance clones (blue, “Up”) plotted above the axis, and reduced abundance clones (red, “Down”) plotted as negative values. Median values for untreated control, prostate, and melanoma groups are plotted as dashed lines. (C) The number of significantly changing clones was determined for three sequential treatments. Increased abundance (blue, “Up”) and decreased abundance (red, “Down”) are indicated. Values are median values from 13 assessed patients within the prostate cancer cohort.
Fig. 3
Fig. 3. Association between clonotype changes and clinical outcome
(A and B) Representative clonotype frequencies that exist at ≥10−3 at baseline for a clinical nonresponder (A) and clinical responder (B) are presented over time. *P = 0.013; **P = 0.004, two-sided Mann-Whitney test. (C to F) The numbers of significantly increased clones were plotted for metastatic CRPC patients (C) and metastatic melanoma patients (D), and the numbers of significantly decreased clones for metastatic CRPC patients (E) and metastatic melanoma patients (F), with each cohort divided by median survival (m, months). Mean values with error bars as SEM are plotted. P values were calculated using a two-sided Mann-Whitney test: *P = 0.0281; **P = 0.006.
Fig. 4
Fig. 4. Clonotype change in naïve and effector CD8 T cells
(A) Gated populations indicate sorting scheme for naïve (CD3+CD8+CD27+CD45RA+) and non-naïve CD8+ T cells. (B) Naïve (blue) or non-naïve (red) T cells sorted before treatment were then sequenced to track clonotypic changes with treatment. The numbers of clones that increased (left panel) and decreased (right panel) after anti–CTLA-4 treatment are shown for three prostate cancer patients and three melanoma patients.
Fig. 5
Fig. 5. Antigen specificity of specific T cell clonotypes
(A) Gated populations indicate CD8+ CMV pp65(495–404) tetramer (rectangle) and tetramer+ (oval) populations sorted by flow cytometry and assessed for TCRβ repertoire sequencing from a clinical responder. (B) Frequency (log10) of each clone identified after TCRβ repertoire sequencing of the sorted tetramer+ and tetramer CD8+ T cells. The three clones indicated in black are those deemed antigen-specific based on fold enrichment in tetramer+ versus tetramer T cells and absolute frequency in tetramer+ cells. (C) TCRβ clone frequencies (log10) at baseline (week 0) and after treatment (week 16). The three clones identified in (B) are indicated in black. (D) Frequencies of the three CMV-specific clones identified in (B) and (C) at baseline (week 0) and at various time points after anti–CTLA-4 treatment. (E) Frequencies of p1182-specific clones (left, center) and p1183-specific clone (right) at baseline and at various time points after anti–CTLA-4 treatment for three different CRPC patients.

References

    1. Kwek SS, Cha E, Fong L. Unmasking the immune recognition of prostate cancer with CTLA4 blockade. Nat Rev Cancer. 2012;12:289–297. - PMC - PubMed
    1. Krummel MF, Allison JP. CTLA-4 engagement inhibits IL-2 accumulation and cell cycle progression upon activation of resting T cells. J Exp Med. 1996;183:2533–2540. - PMC - PubMed
    1. Read S, Malmström V, Powrie F. Cytotoxic T lymphocyte–associated antigen 4 plays an essential role in the function of CD25+CD4+ regulatory cells that control intestinal inflammation. J Exp Med. 2000;192:295–302. - PMC - PubMed
    1. Quezada SA, Peggs KS, Curran MA, Allison JP. CTLA4 blockade and GM-CSF combination immunotherapy alters the intratumor balance of effector and regulatory T cells. J Clin Invest. 2006;116:1935–1945. - PMC - PubMed
    1. Leach DR, Krummel MF, Allison JP. Enhancement of antitumor immunity by CTLA-4 blockade. Science. 1996;271:1734–1736. - PubMed

Publication types

MeSH terms