. 2014 May 29:5:3887.
doi: 10.1038/ncomms4887.

A pan-cancer proteomic perspective on The Cancer Genome Atlas

Affiliations

A pan-cancer proteomic perspective on The Cancer Genome Atlas

Rehan Akbani et al. Nat Commun. .

Erratum in

  • Corrigendum: A pan-cancer proteomic perspective on The Cancer Genome Atlas.
    Akbani R, Ng PK, Werner HM, Shahmoradgoli M, Zhang F, Ju Z, Liu W, Yang JY, Yoshihara K, Li J, Ling S, Seviour EG, Ram PT, Minna JD, Diao L, Tong P, Heymach JV, Hill SM, Dondelinger F, Städler N, Byers LA, Meric-Bernstam F, Weinstein JN, Broom BM, Verhaak RG, Liang H, Mukherjee S, Lu Y, Mills GB. Akbani R, et al. Nat Commun. 2015 Jan 28;6:4852. doi: 10.1038/ncomms5852. Nat Commun. 2015. PMID: 25629879 No abstract available.

Abstract

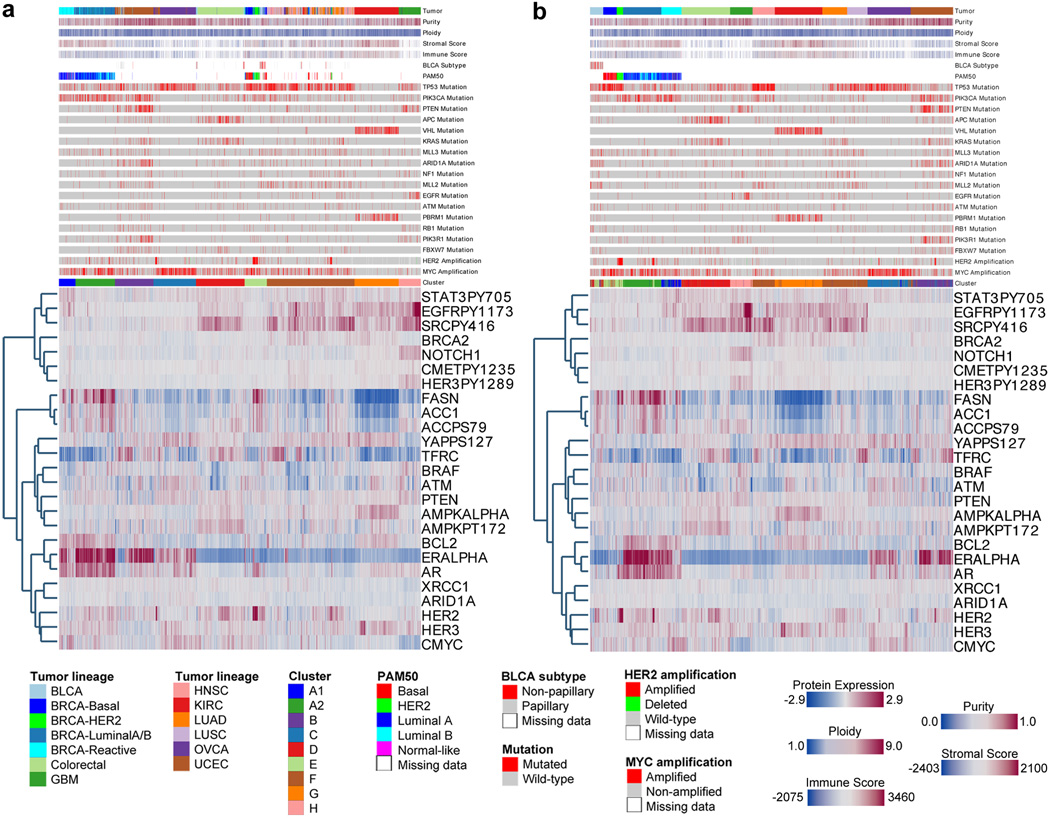
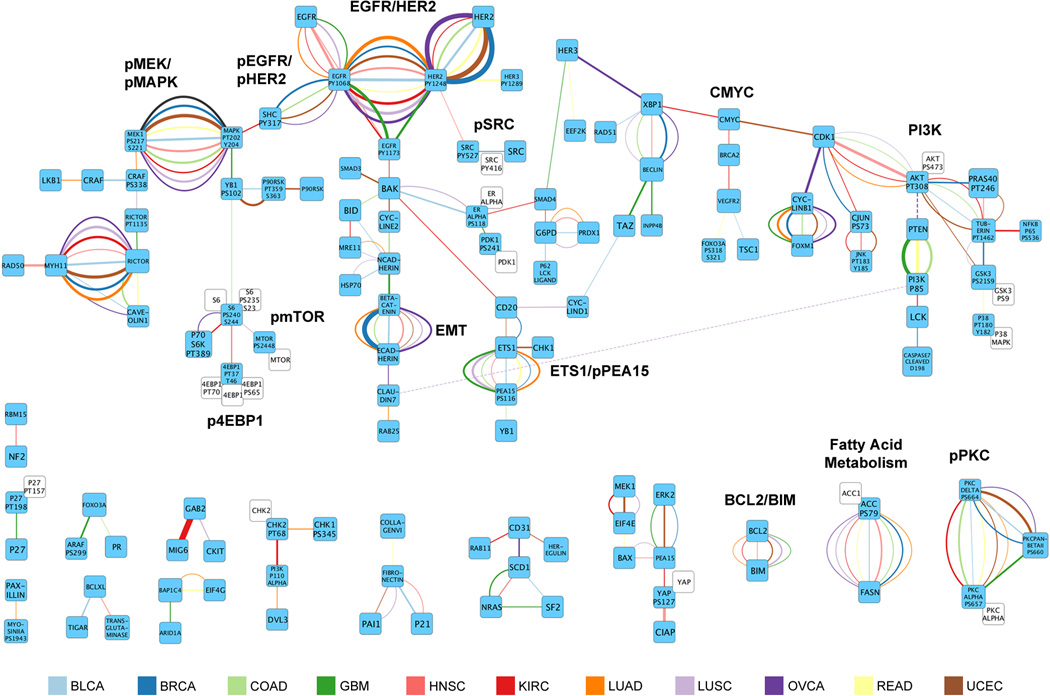
Protein levels and function are poorly predicted by genomic and transcriptomic analysis of patient tumours. Therefore, direct study of the functional proteome has the potential to provide a wealth of information that complements and extends genomic, epigenomic and transcriptomic analysis in The Cancer Genome Atlas (TCGA) projects. Here we use reverse-phase protein arrays to analyse 3,467 patient samples from 11 TCGA 'Pan-Cancer' diseases, using 181 high-quality antibodies that target 128 total proteins and 53 post-translationally modified proteins. The resultant proteomic data are integrated with genomic and transcriptomic analyses of the same samples to identify commonalities, differences, emergent pathways and network biology within and across tumour lineages. In addition, tissue-specific signals are reduced computationally to enhance biomarker and target discovery spanning multiple tumour lineages. This integrative analysis, with an emphasis on pathways and potentially actionable proteins, provides a framework for determining the prognostic, predictive and therapeutic relevance of the functional proteome.


Conflict of interest statement

Conflict of interest

The authors have no conflicts of interest to declare.

Figures

Figure 1
Figure 1. HER2 RPPA correlations with copy number and mRNA
a Histogram of Spearman’s rank correlation (ρ values) for 206 pairs of proteins and matched mRNAs across all tumor types. The black curve represents the background of ρ values using 28,960 random protein-mRNA pairs in the same dataset. b Crosstab identifying HER2-positive tumors by copy number, mRNA expression and protein expression across 11 tumor types. Cutoffs are defined in Methods. BRCA and UCEC are subdivided for clinical relevance regarding HER2 protein levels. Total sample numbers with analyses for all three platforms (CNV, mRNA and protein) are indicated in parentheses. Percentages ≥5% are highlighted (red). c Relationship between HER2 copy number and HER2 protein level by RPPA across all tumor types (n=2,479). The box represents the lower quartile, median and upper quartile, whereas the whiskers represent the most extreme data point within 1.5 × interquartile range from the edge of the box. Each point represents a sample, color-coded by tumor type or subtype. As expected, ERBB2 amplified samples have much higher HER2 protein levels than non-amplified samples. d Relationship between HER2 mRNA and protein expression across all tumor types (n=2,479). Each protein represents a sample, color-coded by tumor type or subtype. Spearman’s correlation between HER2 protein and mRNA is 0.53.
Figure 2
Figure 2. Unsupervised clustering and analyses based on the RBN dataset
a Heatmap depicting protein levels after unsupervised hierarchical clustering of the RBN dataset consisting of 3,467 cancer samples across 11 tumor types and 181 antibodies. Protein levels are indicated on a low-to-high scale (blue-white-red). Eight clusters are defined. Cluster_A has been subdivided into two clusters (A1 and A2), based on the differences between BRCA reactive and remaining luminal subtypes. Annotation bars include tumor type (BRCA-basal separately indicated); purity and ploidy (ABSOLUTE algorithm); stromal and immune scores (ESTIMATE algorithm); BRCA (PAM50 classification) and BLCA subtype; 16 significantly mutated genes and two frequently observed amplifications. The statistical significance of correlations between the clusters and each variable is indicated to the left of each annotation bar (n=3,467, chi-squared, Fisher’s Exact, and ANOVA’s F test. See Methods). b Crosstab showing the number of tumor samples in each cluster. c-e Kaplan Meier curves showing overall survival of (c) the BRCA located in four separate clusters (A1, A2, E and F, n=740), (d) KIRC in cluster_F vs. KIRC in other clusters (n=454) and (e) BLCA in cluster_B vs. BLCA in other clusters (n=127). Follow-up was capped at 60 months due to limited number of events beyond this time. Statistical difference in outcome between groups is indicated by P-value (log-rank test). A high-resolution, interactive version of the heatmap with zooming capability, can be found at (http://bioinformatics.mdanderson.org/main/TCGA/Pancan11/RPPA).
Figure 3
Figure 3. Unsupervised clustering and analyses based on the MC dataset
a Heatmap showing protein expression after unsupervised hierarchical clustering of 3,467 cancer samples across 11 tumor types and 181 antibodies. Protein levels are indicated on a low-to-high scale (blue-white-red). Seven clusters were defined. Cluster_II has been subdivided manually into two clusters (IIa and IIb) based on significant difference in expression of the proteins of interest (HER2 and EGFR). Annotation bars include tumor lineage (BRCA-basal separately indicated), purity and ploidy (ABSOLUTE algorithm); stromal and immune scores (ESTIMATE algorithm); BRCA (PAM50 classification) and BLCA subtype; 16 significantly mutated genes and two frequently observed amplifications. Statistical significance of the correlations between the clusters and each variable is indicated left of the annotation bars (n=3,467, chi-squared, Fisher’s Exact, and ANOVA’s F test. See Methods). b Crosstab showing the number of tumor samples in each cluster. c-g Kaplan Meier curves showing overall survival in (c) the KIRC in cluster_VII vs. in all other clusters (n=454), (d) OVCA in cluster_VII vs. in all other clusters (n=412), (e) KIRC in cluster_IV vs. in all other clusters (n=454), (f) LUSC in cluster_V vs. in all other clusters (n=195) and (g) COAD in cluster_V vs. in all other clusters (n=334). Follow-up has been capped at 60 months months, due to limited number of events beyond this time. Statistical difference in outcome between groups is indicated by P-value (log-rank test). A high-resolution, interactive version of the heatmap with zooming capability, can be found at (http://bioinformatics.mdanderson.org/main/TCGA/Pancan11/RPPA).
Figure 4
Figure 4. Pathway analyses
Pathway analyses of the dataset by RBN clusters, MC clusters and tumor type. For pathway predictor members see Supplementary Table 13. a-b Heatmaps depicting mean pathway scores after unsupervised hierarchical clustering on tumor lineages and protein clusters based on the (a) RBN and (b) MC datasets. The heatmaps were clustered on both axes. As expected, RBN clusters show a strong association with tumor lineages, with very similar patterns between them, whereas MC clusters do not associate with any particular tumor lineage. c-f The heatmaps, supervised on the sample axis, depict the protein levels of the pathway members and of proteins with a high correlation (ρ>0.3/ ρ<−0.3, Spearman’s correlation) to the pathway predictor across RBN clusters (c-d) and tumor lineages (e-f). The EMT pathway (c and e) and the hormone_a pathway (d and f) are shown. Samples are first sorted by either cluster (c-d) or tumor lineage (e-f), then by pathway score (from low to high) within cluster or tumor lineage. Dotplots (lower panel) represent the pathway score for each sample. Each box represents the lower quartile, median and upper quartile, whereas the whiskers represent the most extreme data point within 1.5 × inter-quartile range from the edge of the box. Annotation bars (selected from Fig. 2) are included if statistically associated with the pathway score (P <0.05, Kruskal-Wallis test, n=3,467). Pathway members are marked in red on the left hand side. High-resolution images of the heatmaps can be found online (http://bioinformatics.mdanderson.org/main/TCGA/Pancan11/RPPA).
Figure 5
Figure 5. Analyses of selected potentially actionable proteins
a-b Heatmaps, supervised on the sample axis, depicting protein level of 25 proteins that are (potentially) actionable based on the RBN dataset. Proteins were ordered by unsupervised hierarchical clustering and samples were ordered by (a) cluster and (b) tumor lineage membership and within each ordered by unsupervised hierarchical clustering. Annotation bars include tumor lineage, purity and ploidy (ABSOLUTE algorithm); stromal and immune scores (ESTIMATE algorithm); BRCA (PAM50 classification) and BLCA subtype; 16 significantly mutated genes and two frequently observed amplifications. High-resolution images of the heatmaps can be found online (http://bioinformatics.mdanderson.org/main/TCGA/Pancan11/RPPA).
Figure 6
Figure 6. Unbiased data-driven signaling network
Unbiased signaling network based on a probabilistic graphical models analysis, visualizing all 11 tumor lineages individually. Interplay between nodes was quantified using scores from the graphical model analysis (see Methods), that identify links between nodes whilst controlling for the effects of all other observed nodes. The strength of links is indicated by the thickness of the line whilst the color indicates the tumor lineage in which the link was observed; only the strongest links are shown. Nodes in white are related nodes that were highly correlated and therefore merged prior to network analysis. The adjacent correlated (green) node was then used for network generation. Positive (negative) correlations are indicated with continuous (dotted) lines. A high-resolution image of the network can be found online (http://bioinformatics.mdanderson.org/main/TCGA/Pancan11/RPPA).

References

    1. Myhre S, et al. Influence of DNA copy number and mRNA levels on the expression of breast cancer related proteins. Molecular oncology. 2013;7:704–718. - PMC - PubMed
    1. Park ES, et al. Integrative analysis of proteomic signatures, mutations, and drug responsiveness in the NCI 60 cancer cell line set. Molecular cancer therapeutics. 2010;9:257–267. - PMC - PubMed
    1. Shankavaram UT, et al. Transcript and protein expression profiles of the NCI-60 cancer cell panel: an integromic microarray study. Molecular cancer therapeutics. 2007;6:820–832. - PubMed
    1. Cancer Genome Atlas N. Comprehensive molecular characterization of human colon and rectal cancer. Nature. 2012;487:330–337. - PMC - PubMed
    1. Cancer Genome Atlas N. Comprehensive molecular portraits of human breast tumours. Nature. 2012;490:61–70. - PMC - PubMed

Publication types