

GWAS identifies novel SLE susceptibility genes and explains the association of the HLA region
- PMID: 24871463
- PMCID: PMC4156543
- DOI: 10.1038/gene.2014.23
GWAS identifies novel SLE susceptibility genes and explains the association of the HLA region
Abstract
In a genome-wide association study (GWAS) of individuals of European ancestry afflicted with systemic lupus erythematosus (SLE) the extensive utilization of imputation, step-wise multiple regression, lasso regularization and increasing study power by utilizing false discovery rate instead of a Bonferroni multiple test correction enabled us to identify 13 novel non-human leukocyte antigen (HLA) genes and confirmed the association of four genes previously reported to be associated. Novel genes associated with SLE susceptibility included two transcription factors (EHF and MED1), two components of the NF-κB pathway (RASSF2 and RNF114), one gene involved in adhesion and endothelial migration (CNTN6) and two genes involved in antigen presentation (BIN1 and SEC61G). In addition, the strongly significant association of multiple single-nucleotide polymorphisms (SNPs) in the HLA region was assigned to HLA alleles and serotypes and deconvoluted into four primary signals. The novel SLE-associated genes point to new directions for both the diagnosis and treatment of this debilitating autoimmune disease.
Conflict of interest statement
The authors declare that there are no competing financial interests in the publication of this work.
Figures
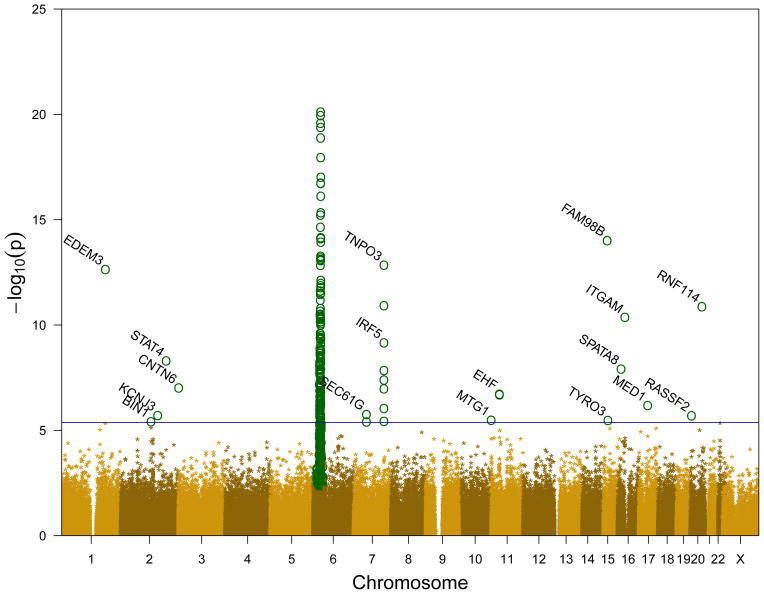
 ), non-significant SNPs (FDR > 0.05) are shown as goldenrod asterisks (
 ). The blue horizontal line is an estimate of the p value where FDR = 0.05 for non-HLA regions.
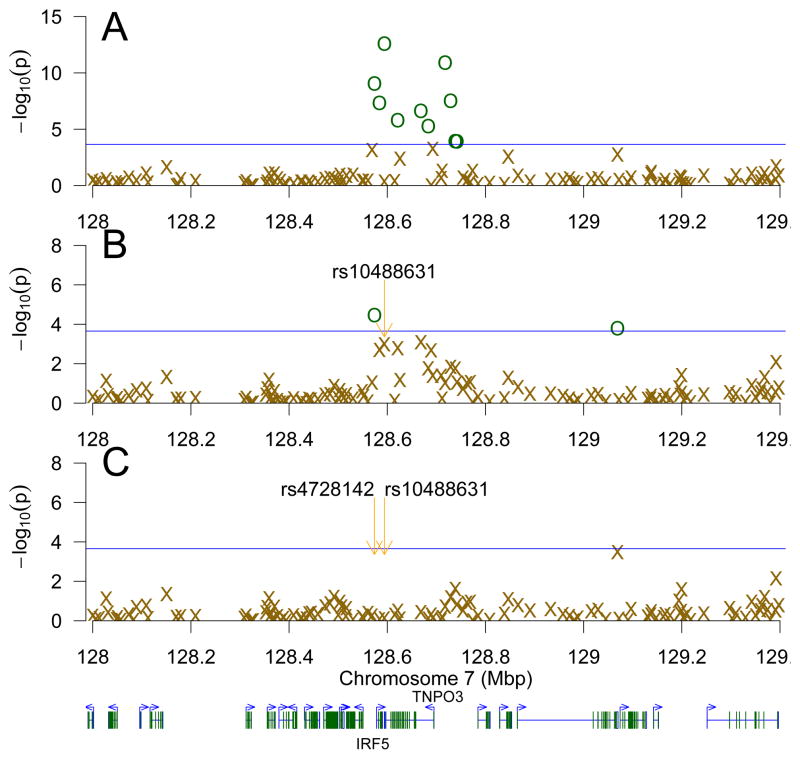 ); those less significant than the threshold are shown as goldenrod Xs (
 ). Panel B accounted for rs10488631 and panel C, for rs4728142 and rs10488631. Genes are depicted below the figure, with the starting positions of IRF5 and TNPO3 indicated.
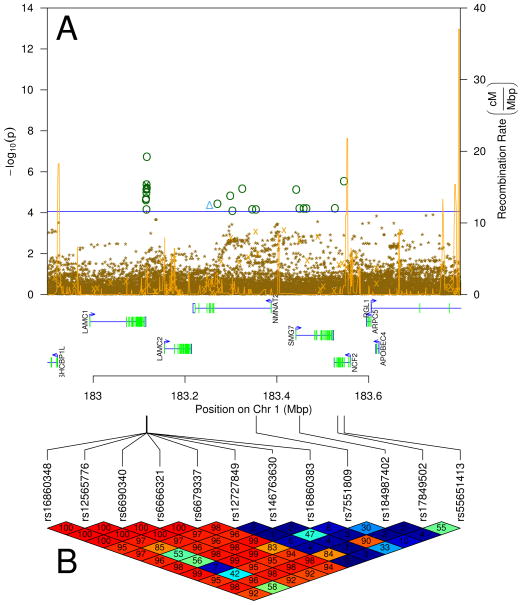 ), significant genotyped SNPs are shown as cyan triangles (
 ), non-significant SNPs (FDR > 0.05) are shown as goldenrod asterisks (
) The blue horizontal line is an estimate of the p value where FDR = 0.05. The spiky gold line depicts the recombination rate in centimorgans per megabase. Panel B shows the LD (D′) of significant SNPs and rs17849502. SNPs in LD (D′ near 100) are red; those not in LD (D′ near 0) are blue, intermediate LD are on the red-orange-yellow-green-blue color continuum.
), non-significant SNPs (FDR > 0.05) are shown as goldenrod asterisks (
) The blue horizontal line is an estimate of the p value where FDR = 0.05. The spiky gold line depicts the recombination rate in centimorgans per megabase. Panel B shows the LD (D′) of significant SNPs and rs17849502. SNPs in LD (D′ near 100) are red; those not in LD (D′ near 0) are blue, intermediate LD are on the red-orange-yellow-green-blue color continuum.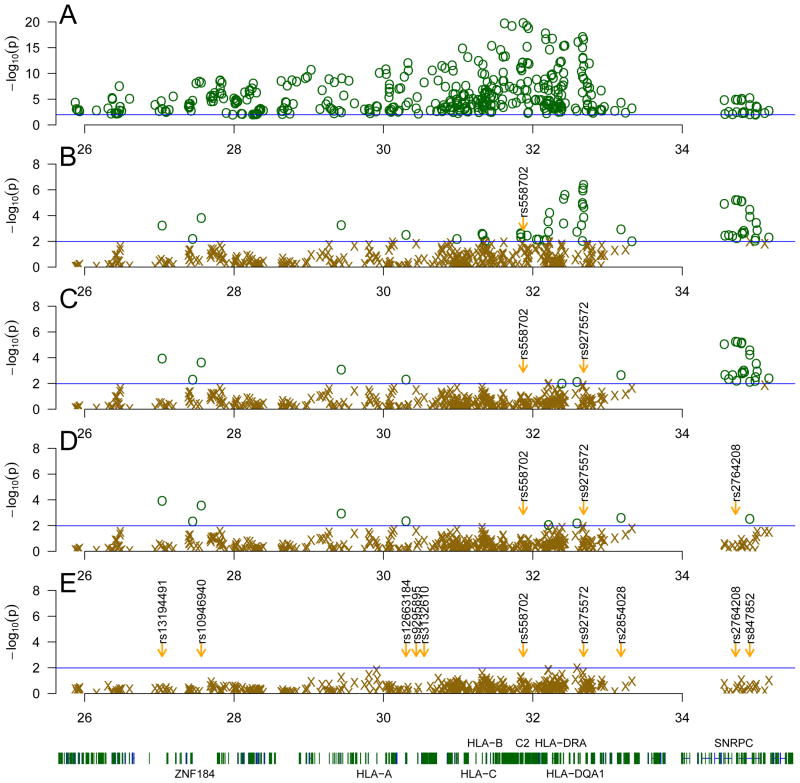 ); those less significant than the threshold are shown as goldenrod Xs (
). Panel B accounted for rs558702, panel C accounted for rs9275572 and rs558702, panel D accounted for rs2764208, rs9275572 and rs558702. After accounting for rs10946940, rs2764208, rs9275572 and rs558702 (panel E), there were no SNPs meeting the genome-wide FDR threshold.
); those less significant than the threshold are shown as goldenrod Xs (
). Panel B accounted for rs558702, panel C accounted for rs9275572 and rs558702, panel D accounted for rs2764208, rs9275572 and rs558702. After accounting for rs10946940, rs2764208, rs9275572 and rs558702 (panel E), there were no SNPs meeting the genome-wide FDR threshold.References
-
- Benjamini Y, Bogomolov M. Selective inference on multiple families of hypotheses. J Royal Stat Soc B. 2014;76:297–318. doi: 10.1111/rssb.12028. - DOI
Publication types
MeSH terms
Substances
Grants and funding
- P60 AR053308/AR/NIAMS NIH HHS/United States
- P01AR49084/AR/NIAMS NIH HHS/United States
- P20 RR020143/RR/NCRR NIH HHS/United States
- R01AR043274/AR/NIAMS NIH HHS/United States
- R56AI063274/AI/NIAID NIH HHS/United States
- RC1AR058621/AR/NIAMS NIH HHS/United States
- R01AR052300/AR/NIAMS NIH HHS/United States
- R37AI024717/AI/NIAID NIH HHS/United States
- UL1TR000004/TR/NCATS NIH HHS/United States
- R01 AR052300/AR/NIAMS NIH HHS/United States
- UL1 TR000004/TR/NCATS NIH HHS/United States
- P01 AR049084/AR/NIAMS NIH HHS/United States
- R01 AR043274/AR/NIAMS NIH HHS/United States
- P20GM103456/GM/NIGMS NIH HHS/United States
- R01AR057172/AR/NIAMS NIH HHS/United States
- P20RR020143/RR/NCRR NIH HHS/United States
- R56 AI063274/AI/NIAID NIH HHS/United States
- P20 GM103456/GM/NIGMS NIH HHS/United States
- R03 AR046405/AR/NIAMS NIH HHS/United States
- P01AI083194/AI/NIAID NIH HHS/United States
- N01 AR062277/AR/NIAMS NIH HHS/United States
- RC1 AR058621/AR/NIAMS NIH HHS/United States
- P30 GM110766/GM/NIGMS NIH HHS/United States
- R01 AR043814/AR/NIAMS NIH HHS/United States
- R37 AI024717/AI/NIAID NIH HHS/United States
- R01 AR042460/AR/NIAMS NIH HHS/United States
- R01 AR057172/AR/NIAMS NIH HHS/United States
- R01AR33062/AR/NIAMS NIH HHS/United States
- R01 AR033062/AR/NIAMS NIH HHS/United States
- R01CA141700/CA/NCI NIH HHS/United States
- ARC_/Arthritis Research UK/United Kingdom
- R01 CA141700/CA/NCI NIH HHS/United States
- R01AR042460/AR/NIAMS NIH HHS/United States
- P60AR053308/AR/NIAMS NIH HHS/United States
- R01AR043814/AR/NIAMS NIH HHS/United States
- P01 AI083194/AI/NIAID NIH HHS/United States
LinkOut - more resources
Full Text Sources
Other Literature Sources
Medical
Research Materials
