

Developmental toxicity assay using high content screening of zebrafish embryos
- PMID: 24871937
- PMCID: PMC4957247
- DOI: 10.1002/jat.3029
Developmental toxicity assay using high content screening of zebrafish embryos
Abstract
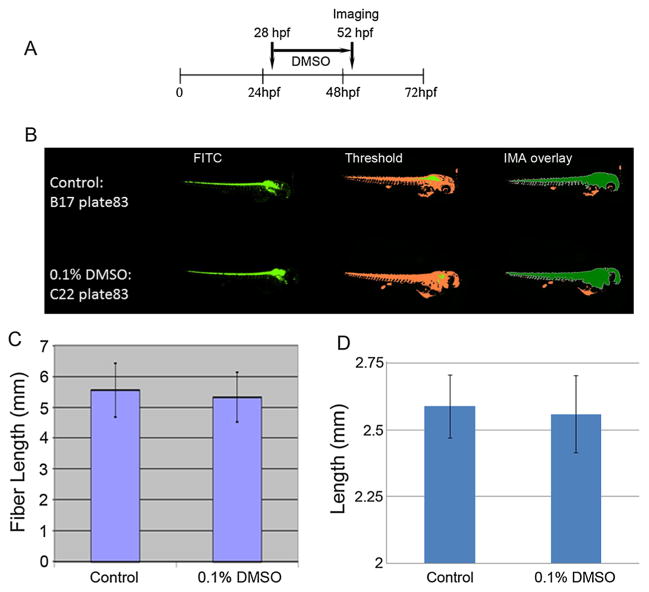
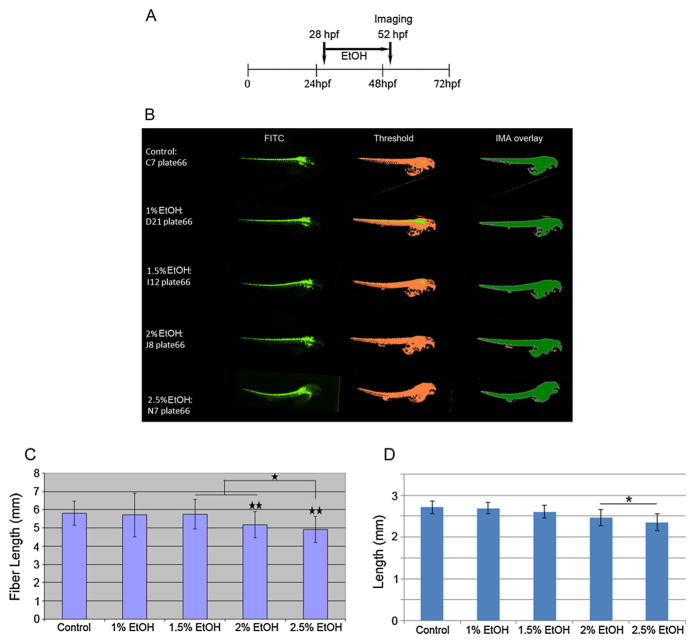
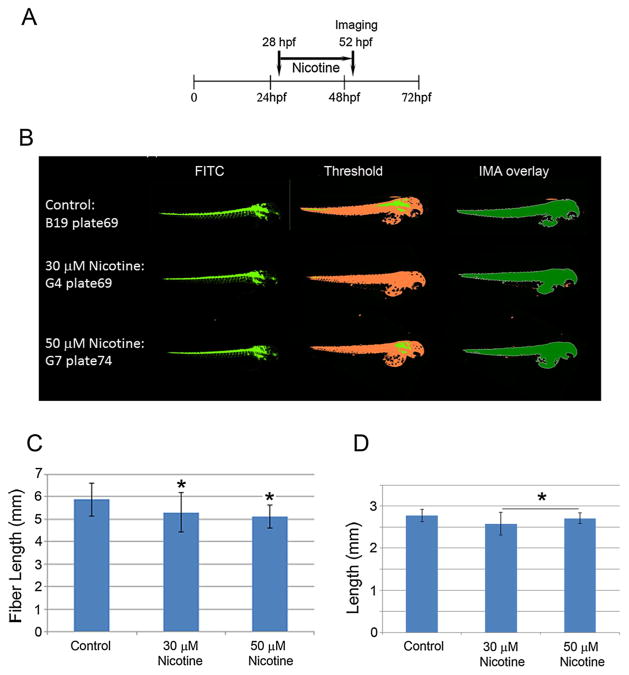
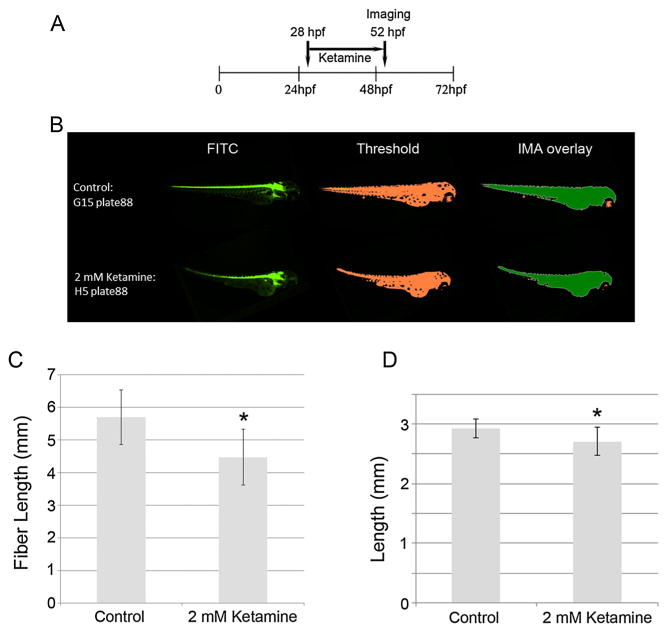
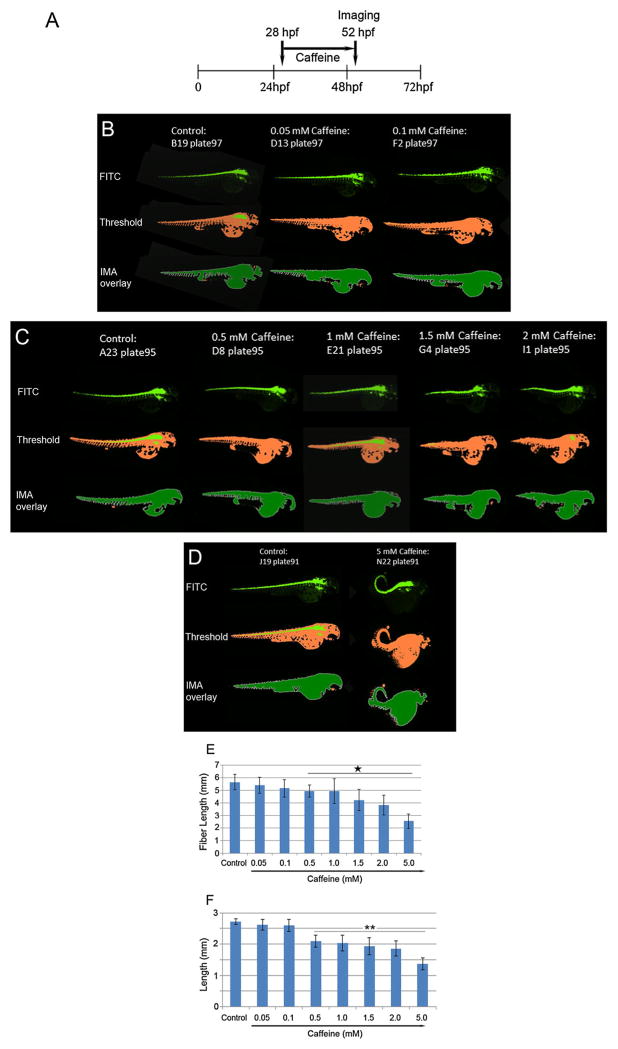
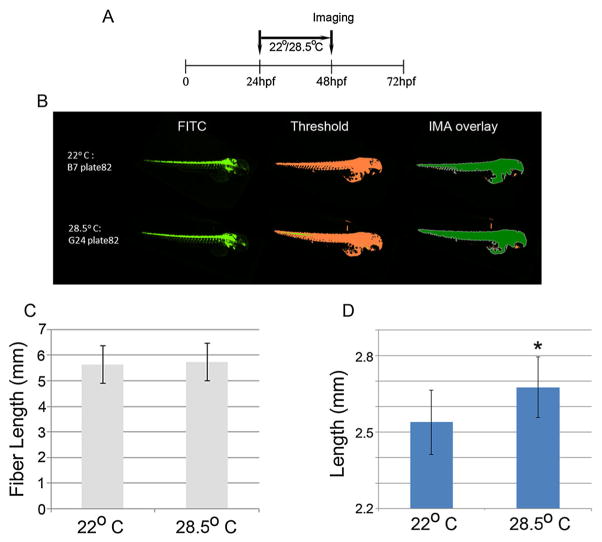
Typically, time-consuming standard toxicological assays using the zebrafish (Danio rerio) embryo model evaluate mortality and teratogenicity after exposure during the first 2 days post-fertilization. Here we describe an automated image-based high content screening (HCS) assay to identify the teratogenic/embryotoxic potential of compounds in zebrafish embryos in vivo. Automated image acquisition was performed using a high content microscope system. Further automated analysis of embryo length, as a statistically quantifiable endpoint of toxicity, was performed on images post-acquisition. The biological effects of ethanol, nicotine, ketamine, caffeine, dimethyl sulfoxide and temperature on zebrafish embryos were assessed. This automated developmental toxicity assay, based on a growth-retardation endpoint should be suitable for evaluating the effects of potential teratogens and developmental toxicants in a high throughput manner. This approach can significantly expedite the screening of potential teratogens and developmental toxicants, thereby improving the current risk assessment process by decreasing analysis time and required resources.
Keywords: automated imaging; ethanol; high content screening; integrated morphometric analysis; ketamine; nicotine; zebrafish embryo.
Published 2014. This article is a U.S. Government work and is in the public domain in the USA.
Figures
Similar articles
-
Automated Morphological Feature Assessment for Zebrafish Embryo Developmental Toxicity Screens.Toxicol Sci. 2019 Feb 1;167(2):438-449. doi: 10.1093/toxsci/kfy250. Toxicol Sci. 2019. PMID: 30295906 Free PMC article.
-
Development of a screening assay to identify teratogenic and embryotoxic chemicals using the zebrafish embryo.Reprod Toxicol. 2009 Nov;28(3):308-20. doi: 10.1016/j.reprotox.2009.05.004. Epub 2009 May 15. Reprod Toxicol. 2009. PMID: 19447169
-
Zebrafish developmental toxicity assay: A fishy solution to reproductive toxicity screening, or just a red herring?Reprod Toxicol. 2011 Sep;32(2):213-9. doi: 10.1016/j.reprotox.2011.06.119. Epub 2011 Jun 21. Reprod Toxicol. 2011. PMID: 21704152
-
Using zebrafish in systems toxicology for developmental toxicity testing.Congenit Anom (Kyoto). 2016 Jan;56(1):18-27. doi: 10.1111/cga.12142. Congenit Anom (Kyoto). 2016. PMID: 26537640 Review.
-
The zebrafish embryotoxicity test (ZET) for nanotoxicity assessment: from morphological to molecular approach.Environ Pollut. 2019 Sep;252(Pt B):1841-1853. doi: 10.1016/j.envpol.2019.06.100. Epub 2019 Jun 28. Environ Pollut. 2019. PMID: 31325757 Review.
Cited by
-
Ketamine Modulates Zic5 Expression via the Notch Signaling Pathway in Neural Crest Induction.Front Mol Neurosci. 2018 Feb 7;11:9. doi: 10.3389/fnmol.2018.00009. eCollection 2018. Front Mol Neurosci. 2018. PMID: 29472839 Free PMC article.
-
Fingerprint Analysis and Comparison of Activity Differences of Crude Venom from Five Species of Vermivorous Cone Snail in the South China Sea.Mar Drugs. 2025 Feb 25;23(3):102. doi: 10.3390/md23030102. Mar Drugs. 2025. PMID: 40137288 Free PMC article.
-
Engineering spatial-organized cardiac organoids for developmental toxicity testing.Stem Cell Reports. 2021 May 11;16(5):1228-1244. doi: 10.1016/j.stemcr.2021.03.013. Epub 2021 Apr 22. Stem Cell Reports. 2021. PMID: 33891865 Free PMC article.
-
Impact of Nicotine Exposure on Hair Cell Toxicity and Embryotoxicity During Zebrafish Development.Clin Exp Otorhinolaryngol. 2018 Jun;11(2):109-117. doi: 10.21053/ceo.2017.00857. Epub 2018 Jan 6. Clin Exp Otorhinolaryngol. 2018. PMID: 29307133 Free PMC article.
-
Validation, Optimization, and Application of the Zebrafish Developmental Toxicity Assay for Pharmaceuticals Under the ICH S5(R3) Guideline.Front Cell Dev Biol. 2021 Sep 14;9:721130. doi: 10.3389/fcell.2021.721130. eCollection 2021. Front Cell Dev Biol. 2021. PMID: 34595173 Free PMC article.
References
-
- Aeschbacher HU, Milon H, Poot A, Wurzner HP. Effect of caffeine on rat offspring from treated dams. Toxicol Lett. 1980;7:71–77. - PubMed
-
- Arenzana FJ, Carvan MJ, 3rd, Aijon J, Sanchez-Gonzalez R, Arevalo R, Porteros A. Teratogenic effects of ethanol exposure on zebrafish visual system development. Neurotoxicol Teratol. 2006;28:342–348. - PubMed
-
- Biala G, Kruk M. Effects of co-administration of bupropion and nicotine or D-amphetamine on the elevated plus maze test in mice. J Pharm Pharmacol. 2009;61:493–502. - PubMed
-
- Bilotta J, Barnett JA, Hancock L, Saszik S. Ethanol exposure alters zebrafish development: a novel model of fetal alcohol syndrome. Neurotoxicol Teratol. 2004;26:737–743. - PubMed
MeSH terms
Substances
Grants and funding
LinkOut - more resources
Full Text Sources
Other Literature Sources
