

Single-dose gadobutrol in comparison with single-dose gadobenate dimeglumine for magnetic resonance imaging of chronic myocardial infarction at 3 T
- PMID: 24872002
- PMCID: PMC4196783
- DOI: 10.1097/RLI.0000000000000076
Single-dose gadobutrol in comparison with single-dose gadobenate dimeglumine for magnetic resonance imaging of chronic myocardial infarction at 3 T
Abstract
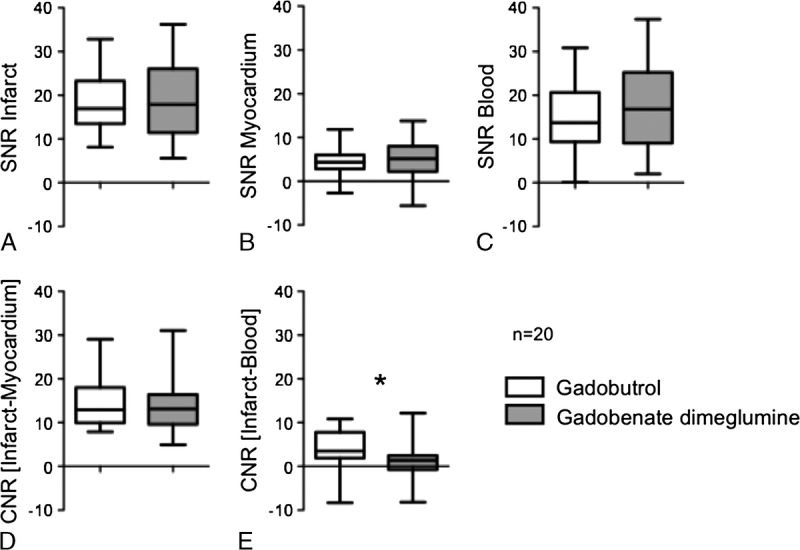
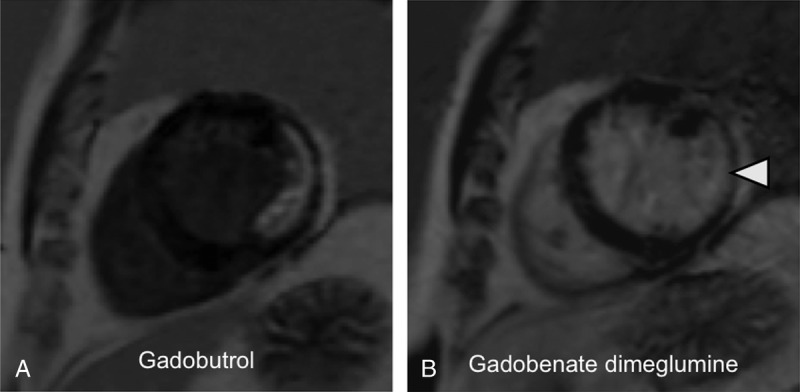
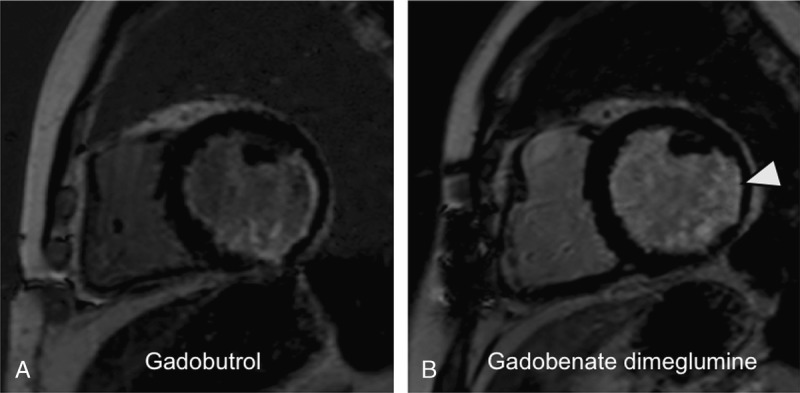
Objectives: The aim of this study was to compare the contrast-to-noise ratio (CNR) values of infarct and remote myocardium as well as infarct and blood after application of 0.1 mmol/kg gadobutrol and 0.1 mmol/kg gadobenate dimeglumine on late gadolinium enhancement magnetic resonance (MR) images.
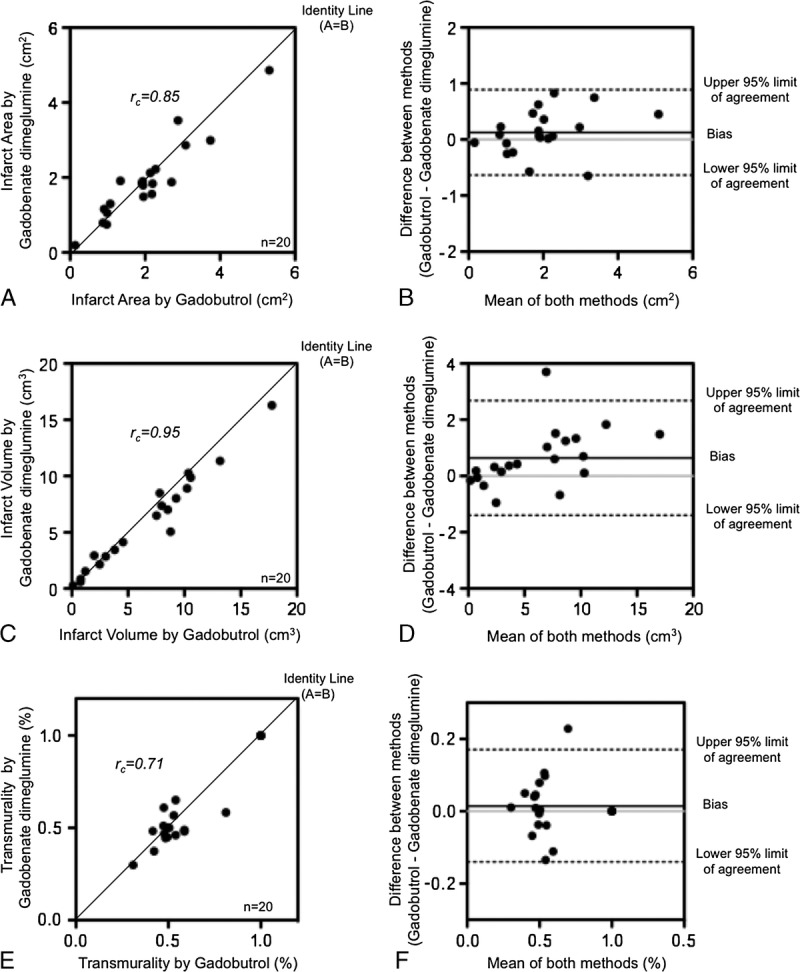
Material and methods: The study was a prospective randomized controlled clinical study. After informed consent was obtained, 20 patients (12 men, 8 women; mean age, 67 ± 11 years) with known chronic myocardial infarction were included for an intraindividual comparison of a single-dose gadobutrol and a single-dose gadobenate dimeglumine. Two MR imaging examinations were performed within a period of 28 days in a crossover design. Late gadolinium enhancement imaging was performed 10 minutes after gadolinium administration using a 2-dimensional phase-sensitive inversion recovery gradient echo sequence at 3 T. Infarct size, signal intensities (SIs), signal-to-noise ratio, and CNR were determined on phase-sensitive MR images. Values for CNR were calculated as CNRinfarct/myocardium = (SIinfarct - SImyocardium)/SDnoise and CNRinfarct/blood = (SIinfarct - SIblood)/SDnoise. In addition, the areas of myocardial infarction were determined on single slices. The entire infarct volumes were calculated by adding the areas with hyperenhancement multiplied by the slice thickness.
Results: Late gadolinium enhancement was present in all patients. Median values of the infarct area, infarct volume, and transmurality for gadobutrol and gadobenate dimeglumine showed good to excellent concordance (rc = 0.85, rc = 0.95, and rc = 0.71, respectively). The mean signal-to-noise ratio values for infarct, remote myocardium, and ventricular blood were 18.6 ± 6.5, 4.1 ± 3.7, and 14.6 ± 7.5, respectively, for gadobutrol and 18.8 ± 8.9, 4.9 ± 4.5, and 17.8 ± 10.1, respectively, for gadobenate dimeglumine (P = 0.93, P = 0.48, and P = 0.149, respectively). The mean values of CNRinfarct/myocardium and CNRinfarct/blood were 14.5 ± 5.9 and 4.0 ± 4.6, respectively, for gadobutrol and 13.9 ± 6.1 and 0.9 ± 4.5, respectively, for gadobenate dimeglumine (P = 0.69 and P = 0.02, respectively).
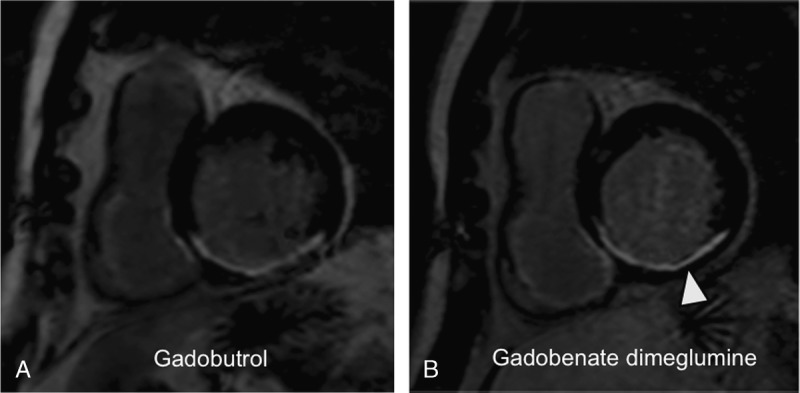
Conclusion: Both gadobutrol and gadobenate dimeglumine allow for successful late gadolinium enhancement imaging of chronic myocardial infarction after a single-dose application (0.1 mmol/kg) at 3 T. Gadobutrol provides a higher CNR between infarct and blood. The CNRs between infarct and normal myocardium, infarct size, and transmural extent were similar for both contrast agents.
Conflict of interest statement
Conflicts of interest and sources of funding: The study was supported by a research grant by Bayer Healthcare.
The authors report no conflicts of interest.
Figures
Similar articles
-
Gadobutrol for magnetic resonance imaging of chronic myocardial infarction: intraindividual comparison with gadopentetate dimeglumine.Invest Radiol. 2012 Mar;47(3):183-8. doi: 10.1097/RLI.0b013e318236e354. Invest Radiol. 2012. PMID: 22183078 Clinical Trial.
-
Low dose gadobenate dimeglumine for imaging of chronic myocardial infarction in comparison with standard dose gadopentetate dimeglumine.Invest Radiol. 2009 Feb;44(2):95-104. doi: 10.1097/RLI.0b013e3181911eab. Invest Radiol. 2009. PMID: 19077911 Clinical Trial.
-
Intraindividual comparison of gadobutrol and gadopentetate dimeglumine for detection of myocardial late enhancement in cardiac MRI.AJR Am J Roentgenol. 2012 Apr;198(4):809-16. doi: 10.2214/AJR.11.7118. AJR Am J Roentgenol. 2012. PMID: 22451545
-
Magnetic resonance imaging for area at risk, myocardial infarction, and myocardial salvage.J Cardiovasc Pharmacol Ther. 2011 Sep-Dec;16(3-4):313-20. doi: 10.1177/1074248411412378. J Cardiovasc Pharmacol Ther. 2011. PMID: 21821534 Free PMC article. Review.
-
Gadobenate.2024 Dec 15. Drugs and Lactation Database (LactMed®) [Internet]. Bethesda (MD): National Institute of Child Health and Human Development; 2006–. 2024 Dec 15. Drugs and Lactation Database (LactMed®) [Internet]. Bethesda (MD): National Institute of Child Health and Human Development; 2006–. PMID: 30000512 Free Books & Documents. Review.
Cited by
-
An In Vitro Model of Nonattached Biofilm-Like Bacterial Aggregates Based on Magnetic Levitation.Appl Environ Microbiol. 2020 Sep 1;86(18):e01074-20. doi: 10.1128/AEM.01074-20. Print 2020 Sep 1. Appl Environ Microbiol. 2020. PMID: 32680859 Free PMC article.
-
Prospective comparison of novel dark blood late gadolinium enhancement with conventional bright blood imaging for the detection of scar.J Cardiovasc Magn Reson. 2017 Nov 21;19(1):91. doi: 10.1186/s12968-017-0407-x. J Cardiovasc Magn Reson. 2017. PMID: 29162123 Free PMC article.
-
Image quality of late gadolinium enhancement in cardiac magnetic resonance with different doses of contrast material in patients with chronic myocardial infarction.Eur Radiol Exp. 2020 Apr 3;4(1):21. doi: 10.1186/s41747-020-00149-2. Eur Radiol Exp. 2020. PMID: 32242266 Free PMC article.
-
The effects of extracellular contrast agent (Gadobutrol) on the precision and reproducibility of cardiovascular magnetic resonance feature tracking.J Cardiovasc Magn Reson. 2016 May 21;18(1):30. doi: 10.1186/s12968-016-0249-y. J Cardiovasc Magn Reson. 2016. PMID: 27209219 Free PMC article.
-
The effect of contrast agents on left ventricular parameters calculated by a threshold-based software module: does it truly matter?Int J Cardiovasc Imaging. 2019 Sep;35(9):1683-1689. doi: 10.1007/s10554-019-01587-9. Epub 2019 Apr 29. Int J Cardiovasc Imaging. 2019. PMID: 31037474 Free PMC article.
References
-
- Gersh BJ, Anderson JL. Thrombolysis and myocardial salvage. Results of clinical trials and the animal paradigm—paradoxic or predictable? Circulation. 1993; 88: 296– 306 - PubMed
-
- Kim RJ, Wu E, Rafael A, et al. The use of contrast-enhanced magnetic resonance imaging to identify reversible myocardial dysfunction. N Engl J Med. 2000; 343: 1445– 1453 - PubMed
-
- Kwong RY, Chan AK, Brown KA, et al. Impact of unrecognized myocardial scar detected by cardiac magnetic resonance imaging on event-free survival in patients presenting with signs or symptoms of coronary artery disease. Circulation. 2006; 113: 2733– 2743 - PubMed
-
- Simonetti OP, Kim RJ, Fieno DS, et al. An improved MR imaging technique for the visualization of myocardial infarction. Radiology. 2001; 218: 215– 223 - PubMed
-
- Rohrer M, Bauer H, Mintorovitch J, et al. Comparison of magnetic properties of MRI contrast media solutions at different magnetic field strengths. Invest Radiol. 2005; 40: 715– 724 - PubMed
Publication types
MeSH terms
Substances
LinkOut - more resources
Full Text Sources
Other Literature Sources
Medical
