Meta-Analysis
. 2014 Jul 1;180(1):15-28.
doi: 10.1093/aje/kwu115. Epub 2014 May 28.

Who is more affected by ozone pollution? A systematic review and meta-analysis

Meta-Analysis

Who is more affected by ozone pollution? A systematic review and meta-analysis

Michelle L Bell et al. Am J Epidemiol. .

Abstract

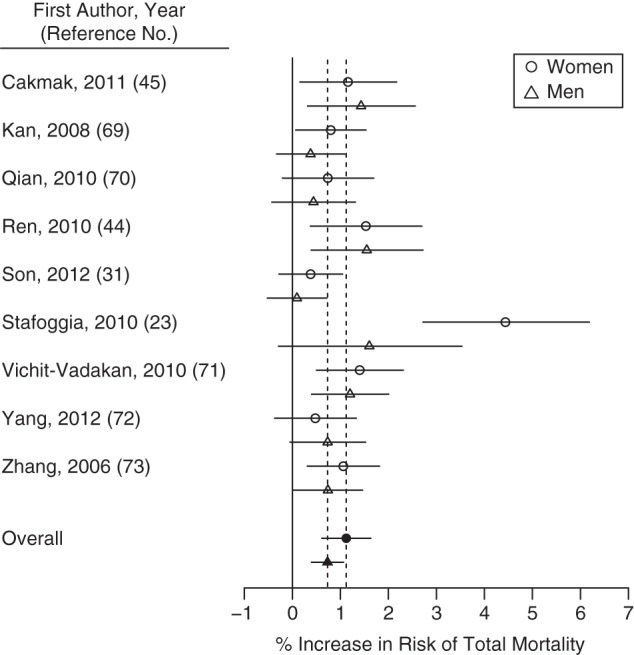
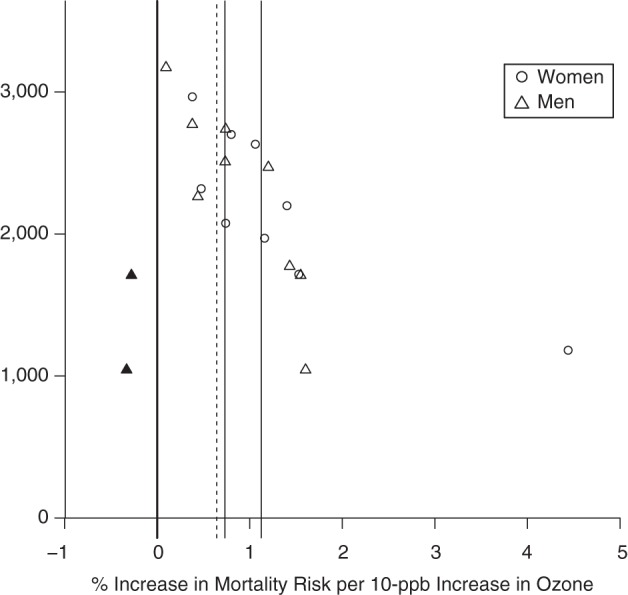
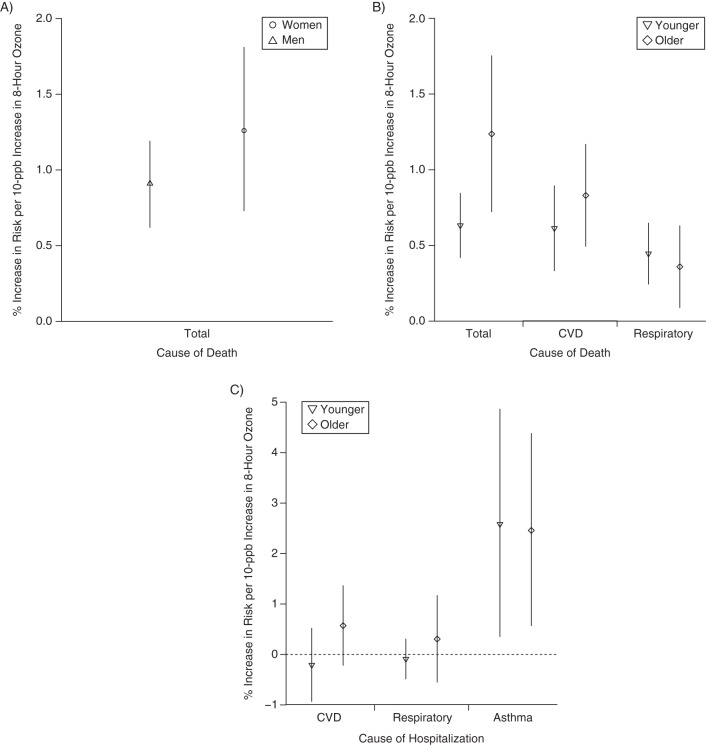
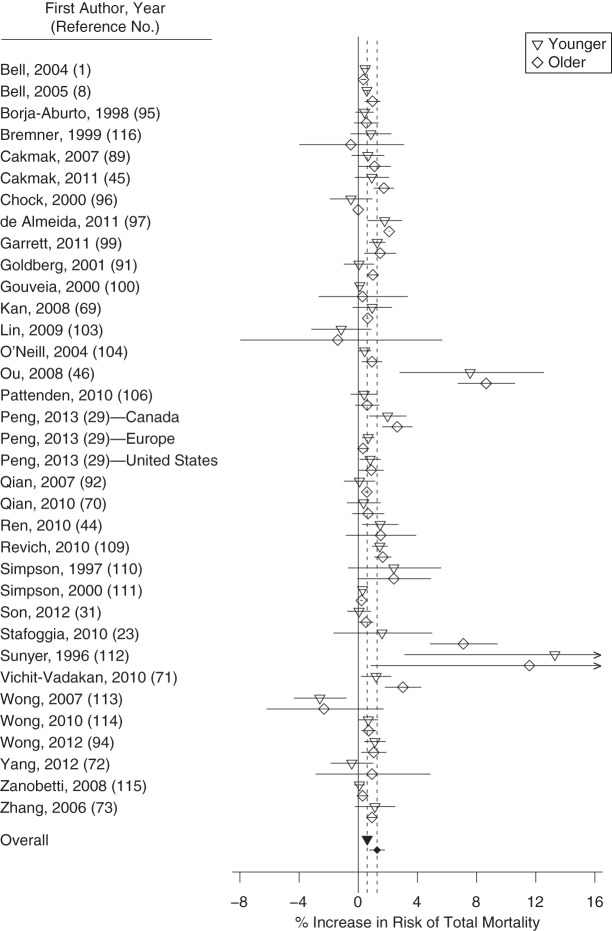
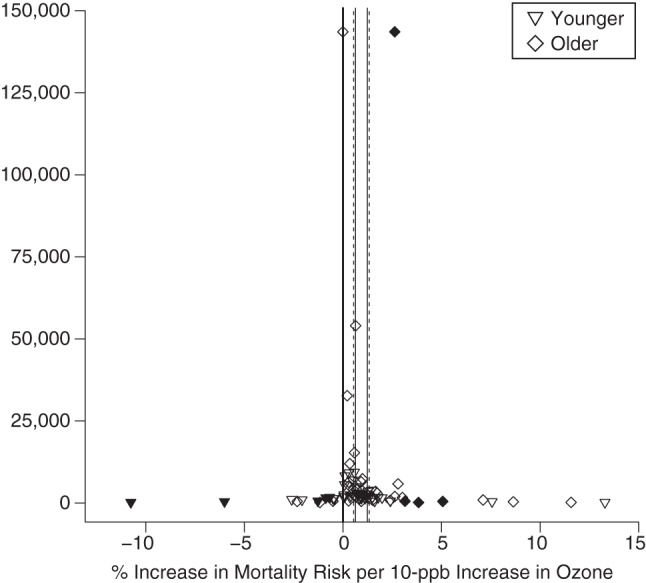
Ozone is associated with adverse health; however, less is known about vulnerable/sensitive populations, which we refer to as sensitive populations. We systematically reviewed epidemiologic evidence (1988-2013) regarding sensitivity to mortality or hospital admission from short-term ozone exposure. We performed meta-analysis for overall associations by age and sex; assessed publication bias; and qualitatively assessed sensitivity to socioeconomic indicators, race/ethnicity, and air conditioning. The search identified 2,091 unique papers, with 167 meeting inclusion criteria (73 on mortality and 96 on hospitalizations and emergency department visits, including 2 examining both mortality and hospitalizations). The strongest evidence for ozone sensitivity was for age. Per 10-parts per billion increase in daily 8-hour ozone concentration, mortality risk for younger persons, at 0.60% (95% confidence interval (CI): 0.40, 0.80), was statistically lower than that for older persons, at 1.27% (95% CI: 0.76, 1.78). Findings adjusted for publication bias were similar. Limited/suggestive evidence was found for higher associations among women; mortality risks were 0.39% (95% CI: -0.22, 1.00) higher than those for men. We identified strong evidence for higher associations with unemployment or lower occupational status and weak evidence of sensitivity for racial/ethnic minorities and persons with low education, in poverty, or without central air conditioning. Findings show that some populations, especially the elderly, are particularly sensitive to short-term ozone exposure.

Keywords: age; air pollution; effect modifiers; hospitalization; mortality; ozone; sex.


Figures

Figure 1.
Figure 1.
Percent increase in risk of total mortality for a 10-ppb increase in 8-hour ozone concentration for published studies included in a meta-analysis, by sex, 1988–2013. The open points represent individual study estimates; the closed points and dashed vertical lines represent overall estimates from the meta-analysis. Horizontal lines represent 95% confidence intervals.
Figure 2.
Figure 2.
Estimates of the association between ozone exposure and total mortality for published studies included in a meta-analysis, by sex, 1988–2013. Estimates show the percentage increase in risk per 10-ppb increase in 8-hour ozone concentration. The open points represent individual study estimates; the closed points represent “missing studies” for which data were derived from the trim-and-fill method to adjust for publication bias. Solid vertical lines represent overall estimates based on study results; dashed lines represent overall estimates adjusted for publication bias.
Figure 3.
Figure 3.
Results from a meta-analysis of associations of ozone exposure with mortality and hospital admission, by sex or age, 1988–2013. A) Risk of mortality by sex; B) risk of mortality by age; C) risk of hospital admission by age. Points represent central estimates for the increase in health risk for a 10-ppb increase in daily 8-hour ozone concentration. Vertical lines represent 95% confidence intervals. CVD, cardiovascular disease.
Figure 4.
Figure 4.
Percent increase in risk of total mortality for a 10-ppb increase in 8-hour ozone concentration for published studies included in a meta-analysis, by age, 1988–2013. The open points represent individual study estimates; the closed points and dashed vertical lines represent overall estimates from the meta-analysis. Horizontal lines represent 95% confidence intervals.
Figure 5.
Figure 5.
Estimates of the association between ozone exposure and total mortality for published studies included in a meta-analysis, by age, 1988–2013. Estimates show the percentage increase in risk per 10-ppb increase in 8-hour ozone concentration. The open points represent individual study estimates; the closed points represent “missing studies” for which data were derived from the trim-and-fill method to adjust for publication bias. Solid vertical lines represent overall estimates based on study results; dashed lines represent overall estimates adjusted for publication bias.

References

    1. Bell ML, McDermott A, Zeger SL, et al. Ozone and short-term mortality in 95 US urban communities, 1987–2000. JAMA. 2004;292(19):2372–2378. - PMC - PubMed
    1. Lim SS, Vos T, Flaxman AD, et al. A comparative risk assessment of burden of disease and injury attributable to 67 risk factors and risk factor clusters in 21 regions, 1990–2010: a systematic analysis for the Global Burden of Disease Study 2010. Lancet. 2012;380(9859):2224–2260. - PMC - PubMed
    1. Jerrett M, Burnett RT, Pope CA, 3rd, et al. Long-term ozone exposure and mortality. N Engl J Med. 2009;360(11):1085–1095. - PMC - PubMed
    1. The Interagency Working Group on Climate Change. A Human Health Perspective on Climate Change: A Report Outlining the Research Needs of the Human Health Effects of Climate Change. Research Triangle Park, NC: National Institute of Environmental Health Sciences; 2010.
    1. Ito K, De Leon SF, Lippmann M. Associations between ozone and daily mortality: analysis and meta-analysis. Epidemiology. 2005;16(4):446–457. - PubMed

Publication types