. 2014 Sep 1;112(5):1105-18.
doi: 10.1152/jn.00884.2013. Epub 2014 May 28.

A functional dissociation between language and multiple-demand systems revealed in patterns of BOLD signal fluctuations

Affiliations

A functional dissociation between language and multiple-demand systems revealed in patterns of BOLD signal fluctuations

Idan Blank et al. J Neurophysiol. .

Abstract

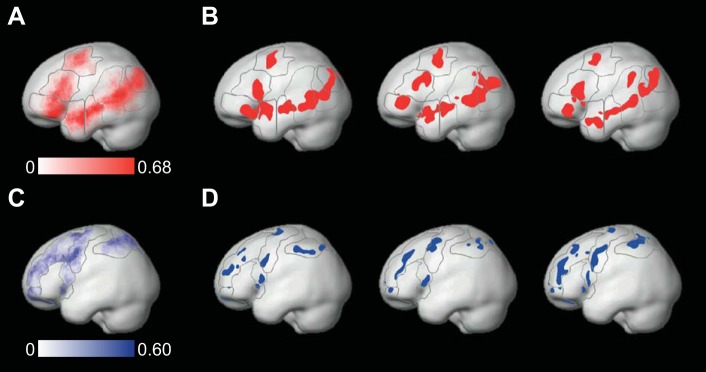
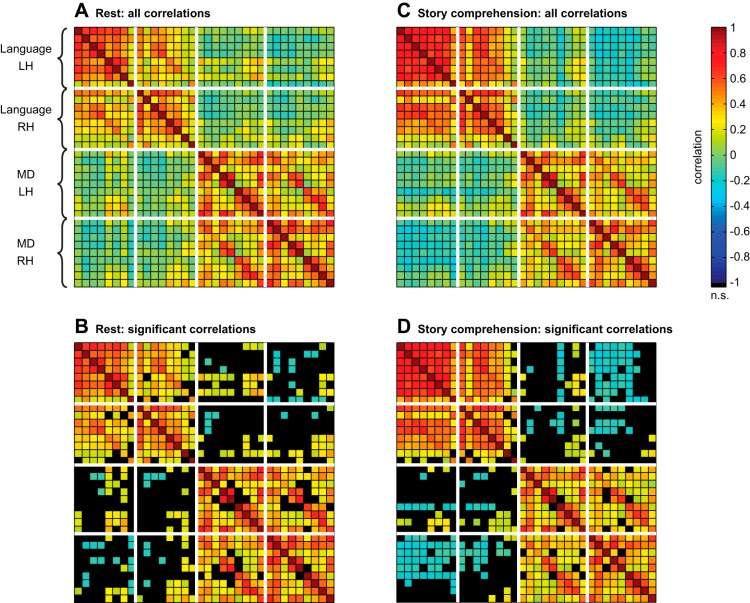
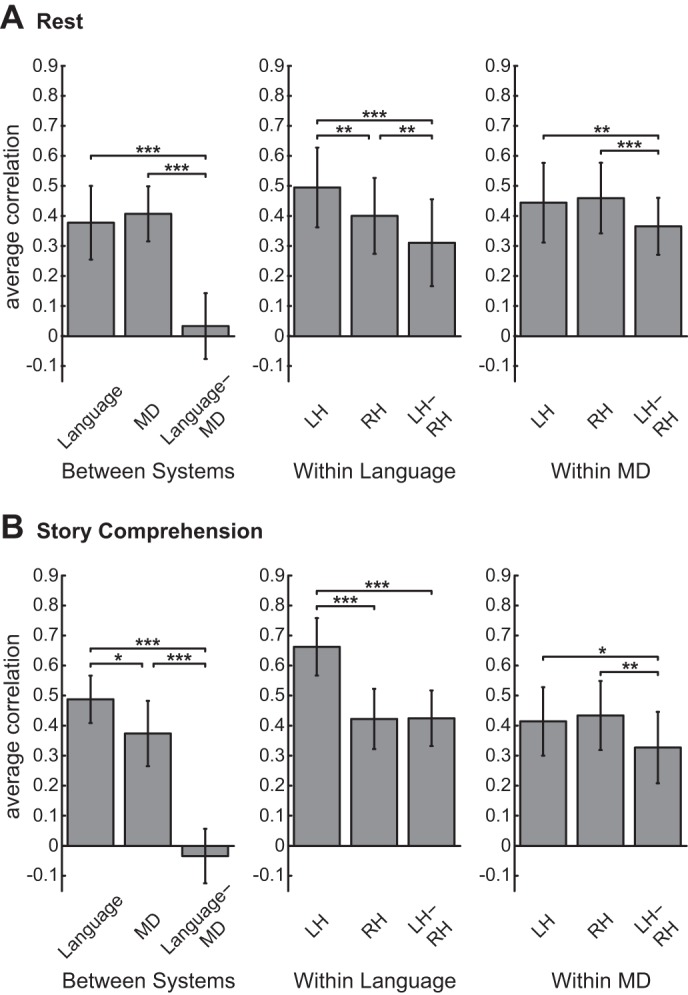
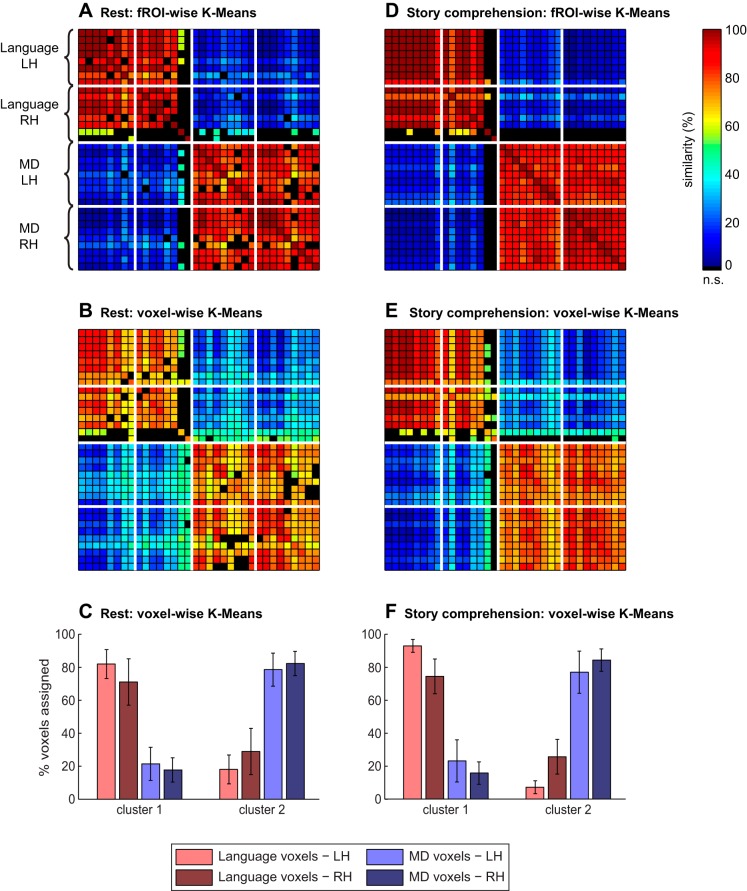
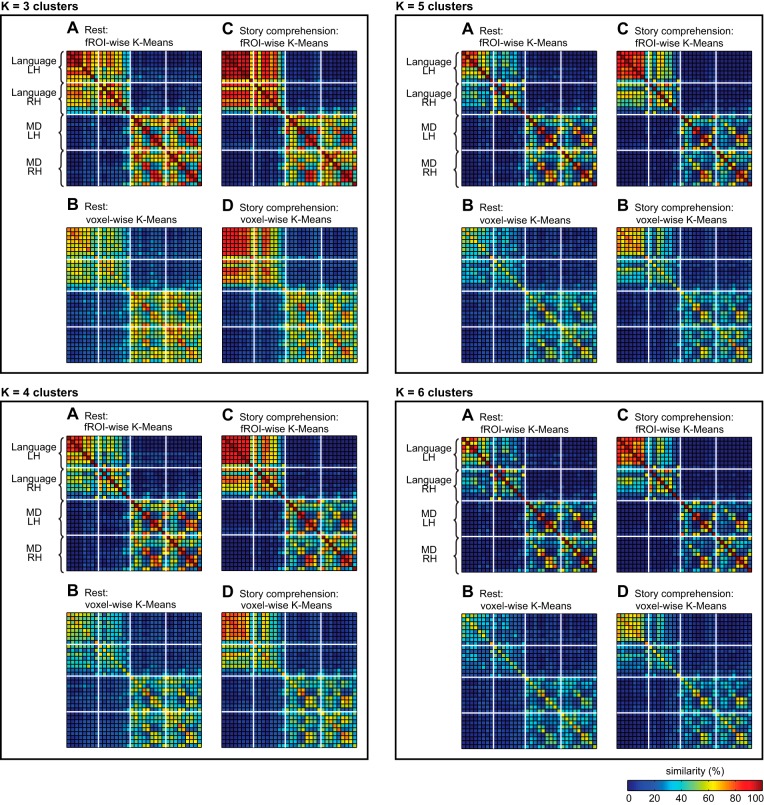
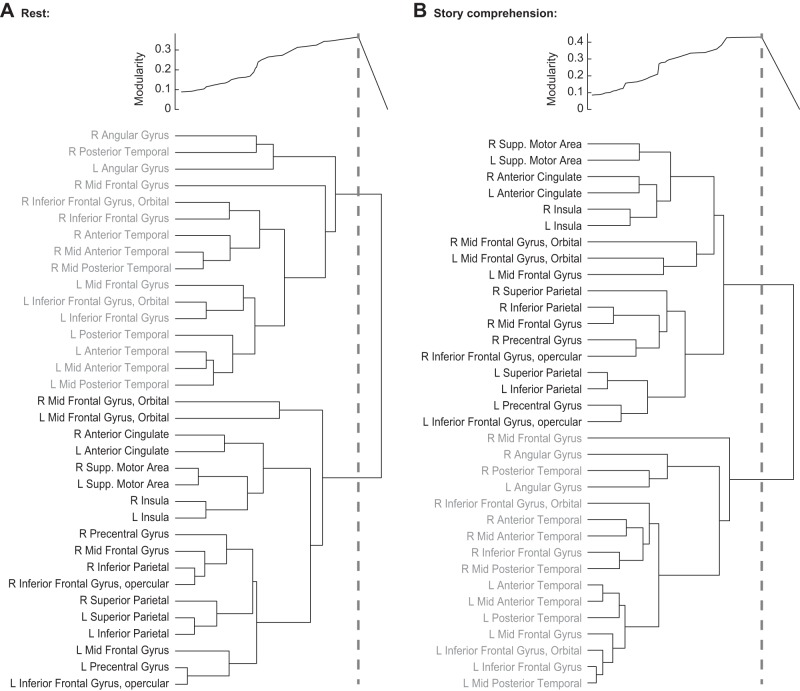
What is the relationship between language and other high-level cognitive functions? Neuroimaging studies have begun to illuminate this question, revealing that some brain regions are quite selectively engaged during language processing, whereas other "multiple-demand" (MD) regions are broadly engaged by diverse cognitive tasks. Nonetheless, the functional dissociation between the language and MD systems remains controversial. Here, we tackle this question with a synergistic combination of functional MRI methods: we first define candidate language-specific and MD regions in each subject individually (using functional localizers) and then measure blood oxygen level-dependent signal fluctuations in these regions during two naturalistic conditions ("rest" and story-comprehension). In both conditions, signal fluctuations strongly correlate among language regions as well as among MD regions, but correlations across systems are weak or negative. Moreover, data-driven clustering analyses based on these inter-region correlations consistently recover two clusters corresponding to the language and MD systems. Thus although each system forms an internally integrated whole, the two systems dissociate sharply from each other. This independent recruitment of the language and MD systems during cognitive processing is consistent with the hypothesis that these two systems support distinct cognitive functions.

Keywords: functional connectivity; language; multiple demand system.


Figures

Fig. 1.
Fig. 1.
Group-constrained, subject-specific functional regions of interest (fROIs). A and C: probability maps of the locations of fROIs across subjects, for the language (red) and multiple-demand (MD; blue) systems, respectively. Higher color saturation corresponds to a higher number of subjects having a significant activation in the relevant voxel. Apparent overlap between fROIs is only at the group level, not the individual subject level. B and D: candidate language fROIs (red) and candidate MD fROIs (blue) in the left hemisphere of 3 representative subjects. In all subfigures, dark gray lines demarcate the masks used to constrain the location of fROIs (see Definition of group-constrained, subject-specific fROIs). All subfigures are in Montreal Neurological Institute space for illustration purposes only (fROI definition and functional correlation analyses were carried out in the native functional space of each individual subject). Apparent overlap between different fROIs only results from the projection of fROIs onto the cortical surface.
Fig. 2.
Fig. 2.
Matrices of fROI-to-fROI functional correlations, for (A) the resting-state condition and (C) the story-comprehension condition. Matrices in B and D present the same data as A and C, respectively, but show only significant correlations [α = 0.05, false discovery rate (FDR) corrected]. Nonsignificant correlations are colored in black. The order of fROIs across rows (and columns) follows Table 1, where regions are sorted by system (language, then MD). Within each system, fROIs are sorted by hemisphere [left hemisphere (LH), then right hemisphere (RH)]. Thick, white lines separate these subsets of fROIs.
Fig. 3.
Fig. 3.
Comparisons of average correlations within and across systems and hemispheres for (A) the resting-state condition and (B) the story-comprehension condition. Three repeated-measures comparisons are presented. Left: comparison of the average pair-wise correlation within the language system (i.e., across all language fROI pairs), the average correlation within the MD system (i.e., across all MD fROI pairs), and the average correlation between the 2 systems (i.e., across all pairs of a language fROI and a MD fROI). Middle: comparison of the average pairwise correlation within the LH, within the RH, and between hemispheres in the language system. Right: comparison of the average pairwise correlation within the LH, within the RH, and between hemispheres in the MD system. Error bars show SDs across subjects; *P < 0.05, **P < 0.01, ***P < 0.001 (Bonferroni corrected for multiple comparisons).
Fig. 4.
Fig. 4.
k-Means clustering results for the resting-state (left) and story-comprehension (right) conditions, with k = 2 clusters. A and D: the average blood oxygenation level-dependent (BOLD) signal time course of each fROI was extracted, and the resulting time courses were clustered. In the fROI-to-ROI similarity matrices plotted here, the color of an entry (i,j) for a given pair of fROIs represents the probability (percentage of clustering solutions across subjects and initializations) that the 2 fROIs would both be assigned to the same cluster. B and E: BOLD signal time courses of all voxels falling within our fROIs were clustered. For each fROI, its “dominant cluster” was then defined as the cluster to which most of the voxels originating within that fROI were assigned. In the fROI-to-ROI similarity matrices plotted here, the color of an entry (i,j) for a given pair of fROIs represents the percentage of voxels in fROI j that was assigned to the dominant cluster of fROI i (note that this is not symmetrical). Percentages are averaged across subjects and initializations. In all matrices (A–D), only significant entries are shown (as assessed with a permutation test, based on phase-shuffling of the original BOLD time courses; α = 0.05, FDR corrected). Nonsignificant entries are colored in black. The order of fROIs across rows (and columns) follows Table 1, where regions are sorted by system (language, then MD). Within each system, fROIs are sorted by hemisphere (LH, then RH). Thick, white lines separate these subsets of fROIs. C and F: same data as in B and E, respectively. The proportion of “language voxels” and “MD voxels” from each hemisphere that were assigned to each cluster is presented (across the 2 clusters, bars of the same color add to 100%). Error bars show SDs across subjects.
Fig. 5.
Fig. 5.
k-Means clustering results of functional correlation data as a function of k. Conventions are the same as in Fig. 4.
Fig. 6.
Fig. 6.
Results of hierarchical clustering for (A) the resting-state condition and (B) the story-comprehension condition. Hierarchical clustering creates a binary tree, with branch length (here, horizontal lines) corresponding to the similarity between fROIs (or sets of fROIs). Above each hierarchical tree, modularity is plotted for all fROI partitions licensed by the tree. Each point on the modularity plot corresponds to a partition generated by drawing an imaginary vertical line from that point through the tree and clustering together only those fROIs that are merged to the left of this line (fROIs that are merged to the right of the line remain in separate clusters). Sample vertical lines are drawn for the maximal modularity, which corresponds to a partition of the data into 2 clusters, 1 consisting of language fROIs and the other consisting of MD fROIs. R, right; L, left; Supp., supplementary; Insula, insular cortex.

References

    1. Amunts K, Schleicher A, Bürgel U, Mohlberg H, Uylings H, Zilles K. Broca's region revisited: cytoarchitecture and intersubject variability. J Comp Neurol 412: 319–341, 1999 - PubMed
    1. Apperly IA, Samson D, Carroll N, Hussain S, Humphreys G. Intact first- and second-order false belief reasoning in a patient with severely impaired grammar. Soc Neurosci 1: 334–348, 2006 - PubMed
    1. Bassett DS, Porter MA, Wymbs NF, Grafton ST, Carlson JM, Mucha PJ. Robust detection of dynamic community structure in networks. Chaos 23: 013142, 2013 - PMC - PubMed
    1. Behzadi Y, Restom K, Liau J, Liu TT. A component based noise correction method (CompCor) for BOLD and perfusion based fMRI. Neuroimage 37: 90–101, 2007 - PMC - PubMed
    1. Bek J, Blades M, Siegal M, Varley RA. Language and spatial reorientation: evidence from severe aphasia. J Exp Psychol 36: 646, 2010 - PubMed

Publication types

LinkOut - more resources