. 2014 May 28;34(22):7639-44.
doi: 10.1523/JNEUROSCI.4216-13.2014.

Simultaneous recordings from the primary visual cortex and lateral geniculate nucleus reveal rhythmic interactions and a cortical source for γ-band oscillations

Affiliations

Simultaneous recordings from the primary visual cortex and lateral geniculate nucleus reveal rhythmic interactions and a cortical source for γ-band oscillations

Andre M Bastos et al. J Neurosci. .

Abstract

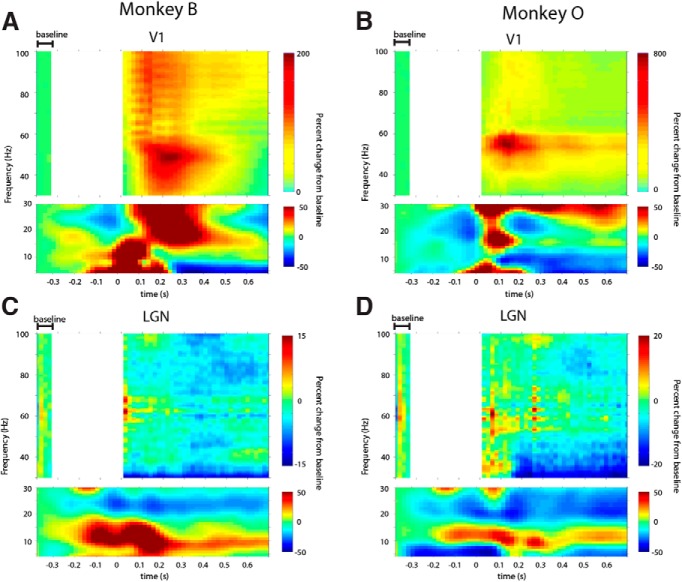
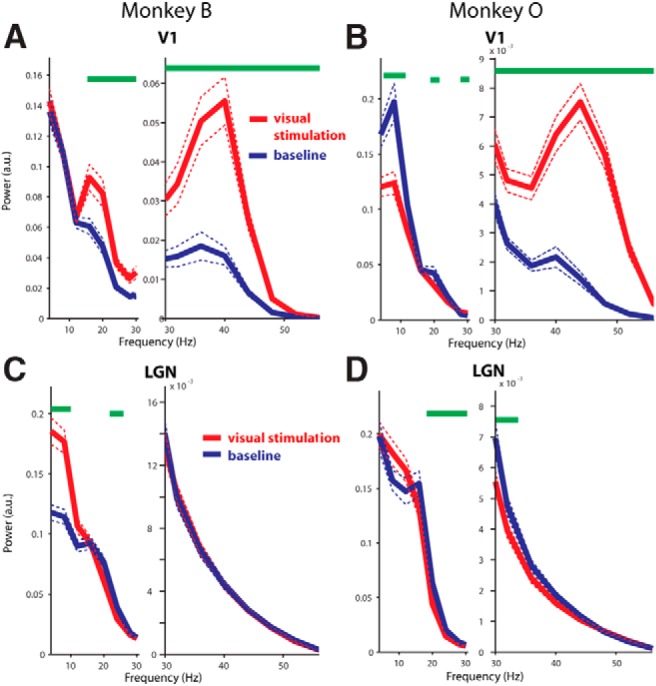
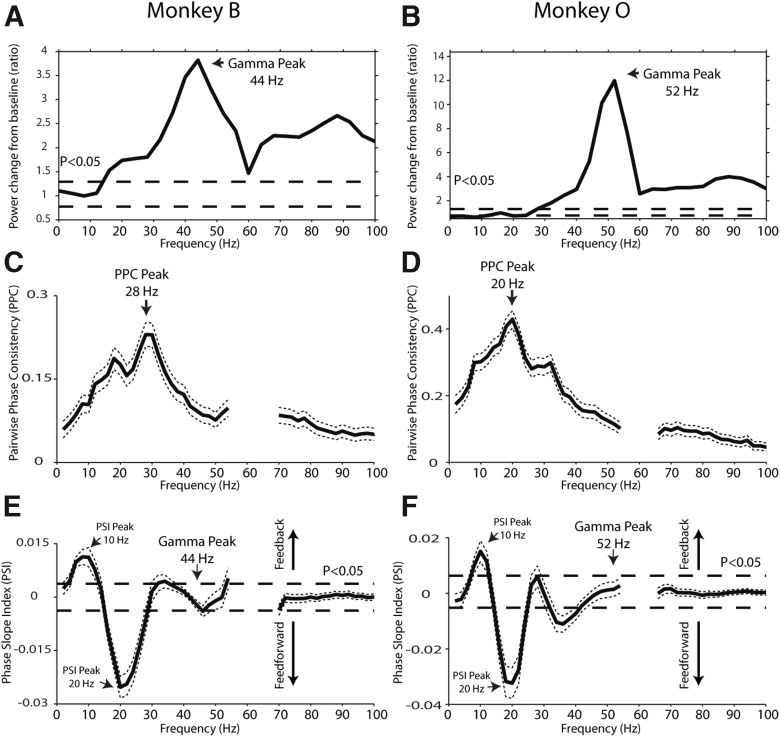
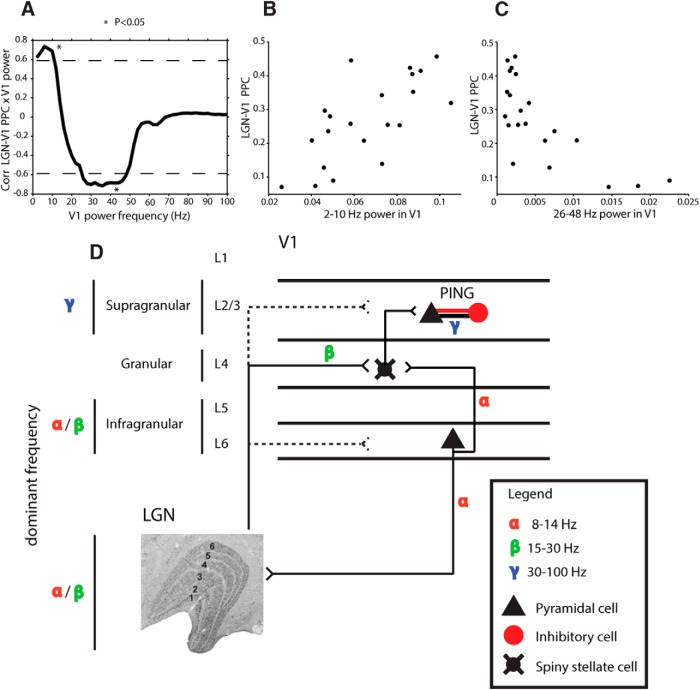
Oscillatory synchronization of neuronal activity has been proposed as a mechanism to modulate effective connectivity between interacting neuronal populations. In the visual system, oscillations in the gamma-frequency range (30-100 Hz) are thought to subserve corticocortical communication. To test whether a similar mechanism might influence subcortical-cortical communication, we recorded local field potential activity from retinotopically aligned regions in the lateral geniculate nucleus (LGN) and primary visual cortex (V1) of alert macaque monkeys viewing stimuli known to produce strong cortical gamma-band oscillations. As predicted, we found robust gamma-band power in V1. In contrast, visual stimulation did not evoke gamma-band activity in the LGN. Interestingly, an analysis of oscillatory phase synchronization of LGN and V1 activity identified synchronization in the alpha (8-14 Hz) and beta (15-30 Hz) frequency bands. Further analysis of directed connectivity revealed that alpha-band interactions mediated corticogeniculate feedback processing, whereas beta-band interactions mediated geniculocortical feedforward processing. These results demonstrate that although the LGN and V1 display functional interactions in the lower frequency bands, gamma-band activity in the alert monkey is largely an emergent property of cortex.

Keywords: LGN; V1; cortex; monkey; oscillations; vision.


Figures

Figure 1.
Figure 1.
Time-frequency response to visual stimulation in the LGN and V1. A, B, Activity profiles for V1 recordings in Monkeys B and O, respectively. Color values indicate decreases or increases in power compared with the baseline, in terms of percentage change. Stimulus onset occurred at time 0. The top subplots show the gamma-band (30–100 Hz), whereas the bottom subplots show the lower-frequencies (4–30 Hz). Scales set by the maximal or minimal percentage change from baseline, whichever was largest. Top subplots are masked between 0 and 320 ms prestimulus to avoid a prestimulus artifact caused by juice reward around this time period. Baseline activity was assessed from the artifact-free prestimulus window indicated. The artifact had negligible power at frequencies 4–30 Hz, so the lower subplots remain unmasked. C, D, Activity profiles for LGN recordings in Monkeys B and O, respectively. Conventions similar to A and B.
Figure 2.
Figure 2.
Power spectra of baseline and visual stimulation periods. A, B, Results from cortical recordings in Monkeys B and O, respectively. Red traces show power during visual stimulation and blue traces show power during the prestimulation baseline in which the monkeys maintained fixation on a central dot. Dotted lines represent the mean ± 2 SEM. Green bars indicate frequency bins that are significantly different between conditions. a.u., Arbitrary units. The spectra are broken between lower frequencies and frequencies surrounding the gamma peak to enhance visualization of the peaks. C, D, Results from LGN recordings in Monkeys B and O, respectively. Conventions similar to A and B.
Figure 3.
Figure 3.
Power modulation spectra in V1 and LGN-V1 interactions. A, B, Ratio of baseline to visual stimulation power across cortical recordings in Monkeys B and O, respectively. Dashed lines indicate confidence levels for significant deviations at p < 0.05. C, D, LGN-V1 oscillatory synchronization, measured by the PPC, during visual stimulation. Dotted lines indicate the mean ± 2 SEM. E, F, LGN-V1 directed interactions, measured by the PSI. Dashed lines indicate the statistical significance threshold at p < 0.05. Positive values above the dashed line indicate significant directed influences from V1 to LGN (feedback influences), negative values below the dashed line indicate significant directed influences from LGN to V1 (feedforward influences). Dotted lines indicate the mean ± 2 SEM.
Figure 4.
Figure 4.
Session by session correlation of LGN-V1 PPC and V1 power, and schematic of LGN-V1 connectivity. A, Correlation spectrum between LGN-V1 PPC and V1 power. Dashed lines denote correlation values that are significant at p < 0.05. B, C, Power by PPC scatter plots of the V1 frequencies (B, 2–10 Hz; C, 26–48 Hz) that are significantly positively (B) and negatively (C) correlated with LGN-V1 PPC across sessions (N = 21). D, Schematic of functional and anatomical connections. The lines interconnecting areas or subpopulations indicate anatomical connections. Dotted lines indicate secondary (weaker) projections. Where functional data exist to indicate which frequency bands mediate the synaptic interactions (Maier et al., 2010; Buffalo et al., 2011; Xing et al., 2012b), the corresponding frequency is indicated.

References

    1. Alonso JM, Martinez LM. Functional connectivity between simple cells and complex cells in cat striate cortex. Nat Neurosci. 1998;1:395–403. doi: 10.1038/1609. - DOI - PubMed
    1. Bastos AM, Usrey WM, Adams RA, Mangun GR, Fries P, Friston KJ. Canonical microcircuits for predictive coding. Neuron. 2012;76:695–711. doi: 10.1016/j.neuron.2012.10.038. - DOI - PMC - PubMed
    1. Bickford ME, Wei H, Eisenback MA, Chomsung RD, Slusarczyk AS, Dankowsi AB. Synaptic organization of thalamocortical axon collaterals in the perigeniculate nucleus and dorsal lateral geniculate nucleus. J Comp Neurol. 2008;508:264–285. doi: 10.1002/cne.21671. - DOI - PMC - PubMed
    1. Bollimunta A, Mo J, Schroeder CE, Ding M. Neuronal mechanisms and attentional modulation of corticothalamic alpha oscillations. J Neurosci. 2011;31:4935–4943. doi: 10.1523/JNEUROSCI.5580-10.2011. - DOI - PMC - PubMed
    1. Bosman CA, Schoffelen JM, Brunet N, Oostenveld R, Bastos AM, Womelsdorf T, Rubehn B, Stieglitz T, De Weerd P, Fries P. Attentional stimulus selection through selective synchronization between monkey visual areas. Neuron. 2012;75:875–888. doi: 10.1016/j.neuron.2012.06.037. - DOI - PMC - PubMed

Publication types