Comparative Study
. 2014 May 28;34(22):7645-56.
doi: 10.1523/JNEUROSCI.0166-14.2014.

The timing of dopamine- and noradrenaline-mediated transmission reflects underlying differences in the extent of spillover and pooling

Affiliations
Comparative Study

The timing of dopamine- and noradrenaline-mediated transmission reflects underlying differences in the extent of spillover and pooling

Nicholas A Courtney et al. J Neurosci. .

Abstract

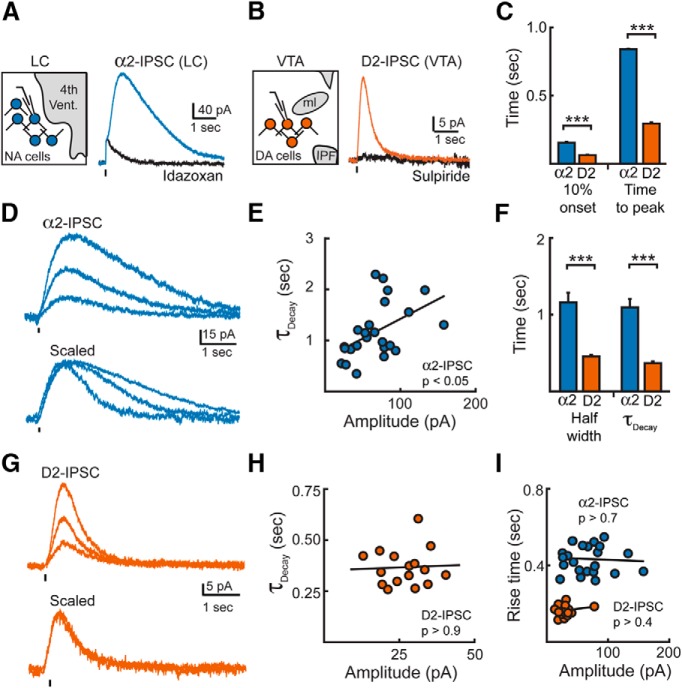
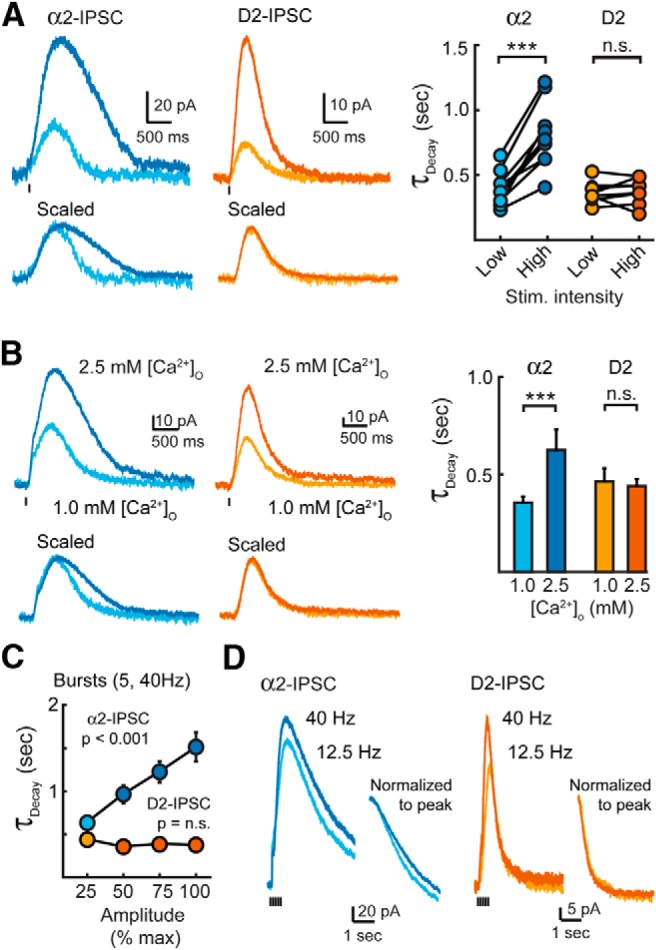
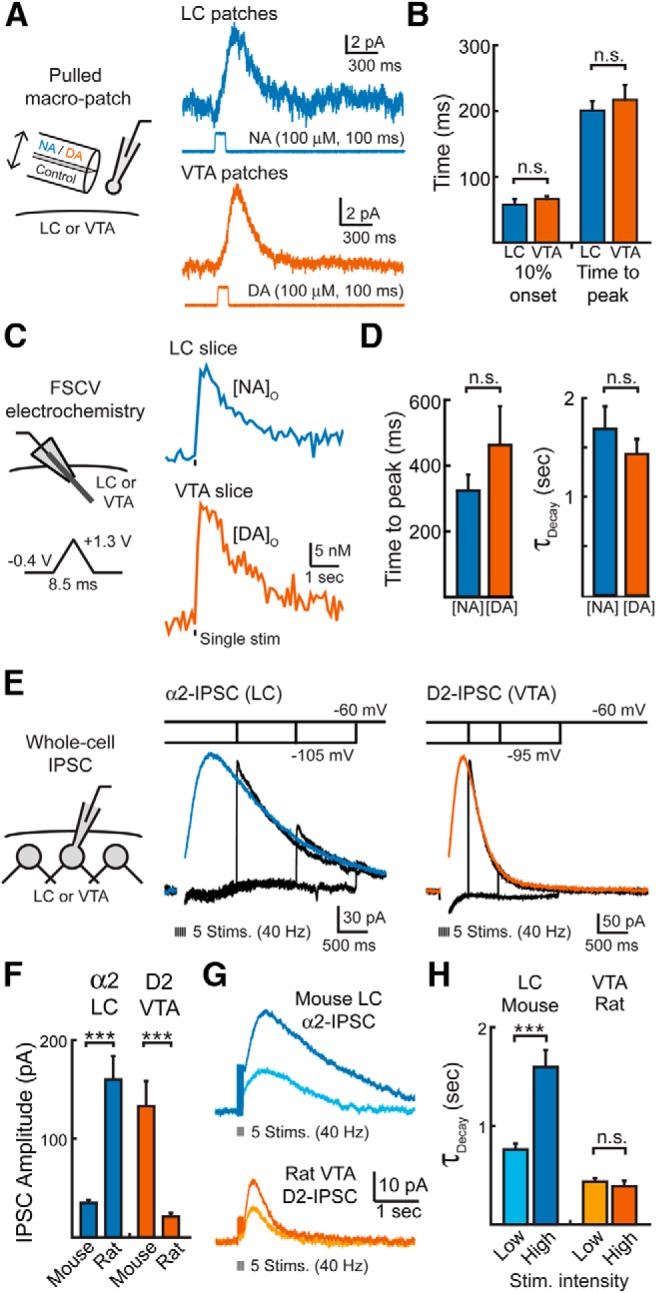
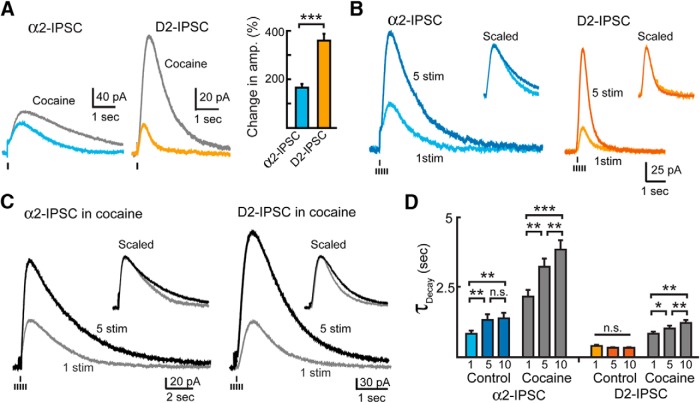
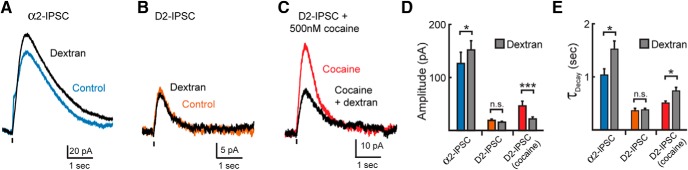
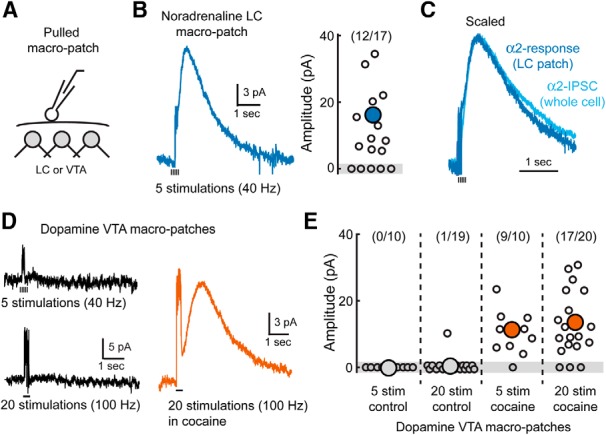
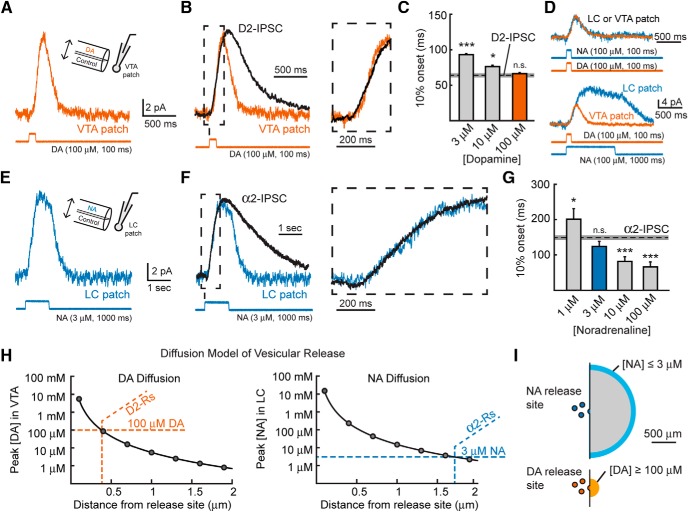
Metabotropic transmission typically occurs through the spillover activation of extrasynaptic receptors. This study examined the mechanisms underlying somatodendritic dopamine and noradrenaline transmission and found that the extent of spillover and pooling varied dramatically between these two transmitters. In the mouse ventral tegmental area, the time course of D2-receptor-mediated IPSCs (D2-IPSCs) was consistent between cells and was unaffected by altering stimulation intensity, probability of release, or the extent of diffusion. Blocking dopamine reuptake with cocaine extended the time course of D2-IPSCs and suggested that transporters strongly limited spillover. As a result, individual release sites contributed independently to the duration of D2-IPSCs. In contrast, increasing the release of noradrenaline in the rat locus ceruleus prolonged the duration of α2-receptor-mediated IPSCs even when reuptake was intact. Spillover and subsequent pooling of noradrenaline activated distal α2-receptors, which prolonged the duration of α2-IPSCs when multiple release sites were activated synchronously. By using the rapid application of agonists onto large macropatches, we determined the concentration profile of agonists underlying the two IPSCs. Incorporating the results into a model simulating extracellular diffusion predicted that the functional range of noradrenaline diffusion was nearly fivefold greater in the locus ceruleus than dopamine in the midbrain. This study demonstrates that catecholamine synapses differentially regulate the extent of spillover and pooling to control the timing of local inhibition and suggests diversity in the roles of uptake and diffusion in governing metabotropic transmission.

Keywords: addiction; integration; monoamine; psychostimulant.


Figures

Figure 1.
Figure 1.
Dopamine and noradrenaline IPSCs have different time courses. A, α2-IPSC from a LC neuron under control conditions and in the presence of idazoxan (2 μm). Ticks illustrate time of stimulation. The current artifact remaining in idazoxan was subtracted to allow for analysis of rise kinetics. Left, Schematic of whole-cell voltage-clamp recordings of noradrenaline neurons in the LC. B, Averaged D2-IPSCs from a VTA neuron under control conditions and in the presence of sulpiride (200 nm). C, Summary of the 10% onset and time to peak of α2-IPSCs (n = 26) or D2-IPSCs (n = 17; Student's t test). Artifacts remaining in the presence of antagonists (idazoxan in the LC or sulpiride in the VTA) were subtracted from control α2-IPSCs or D2-IPSCs when analyzing each cell. D, Representative averages of α2-IPSCs grouped by amplitude. Traces in the presence of idazoxan were subtracted to remove stimulation artifact. Bottom, Traces from top scaled to their peak amplitude. E, Decay time correlates with amplitude for α2-IPSCs. Circles represent IPSCs recorded from individual cells (Pearson's correlation). F, Summary data of the half-width and τdecay of α2-IPSCs (n = 26) and D2-IPSCs (n = 17; Student's t test). G, Representative averages of D2-IPSCs grouped by amplitude. Stimulation artifacts blanked for clarity. H, Decay time does not correlate with amplitude for D2-IPSCs (Pearson's correlation). Circles represent IPSCs recorded from individual cells. I, Lack of correlation of rise time (10–90%) with amplitude of IPSCs (Pearson's correlation). Circles represent IPSCs recorded from individual cells. ***p < 0.001; error bars indicate ± SEM.
Figure 2.
Figure 2.
Increasing noradrenaline release prolongs the decay time of α2-IPSCs. A, Averaged α2-IPSCs (n = 9) and D2-IPSCs (n = 8) evoked by high- and low-intensity stimulation. Right, Quantification of the decay times of individual IPSCs. Changing the stimulation intensity had no effect on the decay time of D2-IPSCs (Student's paired t test). B, Averaged α2-IPSCs (n = 8) and D2-IPSCs (n = 5) evoked with a single stimulation and recorded in 1.0 and 2.5 mm extracellular Ca2+ ([Ca]o). Right, Summary data of decay times in different extracellular [Ca2+] (Student's paired t test). C, Summary quantification of the decay time of IPSCs evoked by bursts when divided into quartiles based upon their maximum amplitude (α2-IPSCs: n = 15, D2-IPSCs: n = 12). For α2-IPSCs, longer decay times were significantly correlated with larger amplitude quartiles (Pearson's correlation). D, Averaged noradrenaline α2-IPSCs (n = 5) and D2-IPSCs (n = 5) evoked by a burst of stimuli at 12.5 and 40 Hz. Inset, Decay phase of IPSCs normalized and aligned to their peak when evoked by a burst of stimuli at 12.5 or 40 Hz. Stimulation artifacts were blanked for clarity. n.s., p > 0.05; **p < 0.01; error bars indicate ± SEM.
Figure 3.
Figure 3.
The duration of GIRK signaling, transmitter release and the synaptic conductance are similar for dopamine and noradrenaline. A, Left, schematic of experimental condition for catecholamine rapid-flow application onto nucleated patches. Right, Representative traces of currents evoked after the rapid-flow application of noradrenaline (100 μm; 100 ms) onto nucleated patches of LC cells or dopamine application (100 μm; 100 ms) onto nucleated patches of VTA cells. B, Summary data illustrating the time until 10% onset and the time to peak of currents evoked in patches (Student's t test). C, Left, Schematic of the FSCV experimental condition. Right, Averaged FSCV traces measuring the extracellular concentration of noradrenaline [NA]o in the LC (n = 13) or the extracellular concentration of dopamine [DA]o in the VTA (n = 9). Release was evoked by a single pulse. D, Summary data of the time to peak and decay kinetics of [NA]o and [DA]o (Student's t test). E, Left, Schematic of whole-cell voltage-clamp recordings. Right, Current responses to a series of voltage jumps after synaptic stimulation. Voltage jumps were given from near the potassium equilibrium potential (between −95 and −105 mV) to the test potential of −60 mV at 500, 1000, and 1500 ms after stimulation while recording D2-IPSCs and 1000, 2000, and 3000 ms after stimulation while recording α2-IPSCs (black traces). IPSCs were evoked by a burst of stimuli. Each trace is the average of three to five events from three VTA dopamine cells and six LC noradrenaline cells. IPSCs after the jump were separated from the capacitance transients recorded with no extracellular stimulation. After the voltage jump, the instantaneous IPSCs (black) rapidly approached control IPSCs (color) recorded at −60 mV, indicating that the synaptic conductance was still active. The stimulation artifact was blanked for clarity. F, Summary data of the peak amplitude of D2-IPSCs or α2-IPSCs evoked by five stimulations (40 Hz) in either the mouse or rat (Student's t test). G, Average traces illustrating the D2-IPSCs and α2-IPSCs in the mouse and rat. Top, α2-IPSCs evoked in the mouse LC have different kinetics when evoked by high- or low-intensity stimulation. Bottom, D2-IPSCs evoked in the rat VTA have the same kinetics independent of stimulation intensity. H, Quantification of the decay kinetics shown in G (Student's paired t test). n.s., p > 0.05; error bars indicate ± SEM.
Figure 4.
Figure 4.
Transporters limit dopamine spillover. A, Left, Representative traces of single-stimulation IPSCs in control conditions and the increase in amplitude and duration in the presence of cocaine (2 μm, gray). Right, Quantification showing the increase in amplitude of IPSCs recorded in the presence of cocaine. Cocaine potentiated the amplitude of D2-IPSCs more than α2-IPSCs (Student's t test). B, Left, Averaged α2-IPSCs (n = 11) and D2-IPSCs (n = 11) evoked by single stimulation or a train of five stimuli. Insets, Average IPSCs normalized to peak amplitude. C, Averaged α2-IPSCs and D2-IPSCs evoked by either a single stimulation or a train of five stimuli in the presence of cocaine (2 μm). Inset, Averaged IPSCs in the presence of cocaine normalized to peak amplitude. D, Quantification of IPSC decay times when evoked by a single stimulation or bursts of 5 or 10 stimulations in the absence or presence of cocaine (2 μm, gray). Trains of stimuli failed to potentiate the decay time of D2-IPSCs under control conditions. Blocking reuptake with cocaine allowed trains of stimuli to evoke longer duration dopamine IPSCs (repeated-measures ANOVA, Bonferroni post hoc test). n.s., p > 0.05; *p < 0.05; **p < 0.01; ***p < 0.001; error bars indicate ± SEM.
Figure 5.
Figure 5.
Slowing diffusion alters α2-IPSCs, but not D2-IPSCs, unless reuptake is inhibited. A, Averaged α2-IPSC (n = 10) illustrating the effect of dextran (5% w/v). B, Averaged D2-IPSC (n = 9) illustrating the lack of effect of dextran. C, Averaged D2-IPSC in the presence of cocaine (500 nm; n = 6) illustrating the effect of dextran. D, E, Quantification of the amplitude (D) and decay time (E) of IPSCs recorded in control solution (colored bars) and dextran (gray bars; Student's paired t test). n.s., p > 0.05; *p < 0.05; ***p < 0.001; error bars indicate ± SEM.
Figure 6.
Figure 6.
Spillover activates D2 receptors when uptake is inhibited. A, Schematic of experimental condition. Large sensor patches from the LC or VTA were pulled out from the slice and repositioned at the surface. B, Left, Averaged α2-receptor-mediated current from noradrenaline neuron sensor patches (n = 17). Noradrenaline release was evoked from within the LC by a train of stimuli. The stimulating electrode was positioned in the LC in a similar location used to evoke α2-IPSCs. Right, Distribution of current amplitudes recorded in all sensor patches from the LC. Outward currents could be detected in the majority of LC patches. C, Normalized, averaged whole-cell α2-IPSC recorded within the LC (n = 15) and α2-receptor-mediated current from a sensor patch recorded at the surface of the LC (n = 12). D, Averaged D2-receptor-mediated currents from dopamine neuron sensor patches. Left, Control recordings from VTA sensor patches did not respond to dopamine release evoked by a burst of stimuli (five pulses, 40 Hz; or 20 pulses, 100 Hz). Right, Averaged D2-receptor current in the presence of cocaine (5 μm; 20 pulses, 100 Hz). E, Distribution of amplitudes of dopamine sensor patch currents in all conditions.
Figure 7.
Figure 7.
D2-receptors mediating the IPSC are located near the site of release. A, Average current when 100 μm DA was applied to VTA macropatches for 100 ms (n = 13). Inset, Schematic of the experimental paradigm. B, 100 μm DA mimics the rise kinetics of D2-IPSCs recorded in VTA slices. Right, Expansion of the rising phase (box) with the same time scale as the expansion in F. C, Quantification of the 10% onset of various concentrations of DA applied to VTA patches for 100 ms. The dashed line represents the 10% onset of D2-IPSCs measured in VTA slices, with the gray box indicating the SE (Student's t test). D, Currents resulting from 100 μm NA applied to LC macropatches for 100 ms (n = 6, top) or 1000 ms (n = 9, bottom) have similar onset kinetics as when 100 μm DA was applied to VTA patches. E, Average current when 3 μm NA was applied to LC macropatches for 1000 ms (n = 11). F, 3 μm NA mimics the rise kinetics of α2-IPSCs recorded in LC slices. Right, Expansion of the rising phase (box) with the same time scale as the expansion in B. G, Quantification of the 10% onset of various concentrations of NA applied to LC patches for 1000 ms. The dashed line represents the 10% onset of α2-IPSCs recorded in LC slices, with the gray box indicating the SE (Student's t test). H, Peak concentration versus distance of dopamine (left) and noradrenaline (right) diffusing away from a single vesicle of transmitter release generated by a model of point diffusion in the absence of reuptake. Orange lines indicate the distance at which DA reaches the 100 μm required to mimic D2-IPSC onset kinetics. Blue lines indicate the distance at which NA reaches the 3 μm required to mimic α2-IPSC onset kinetics. I, Scaled diagram demonstrating the spatial range of dopamine and noradrenaline diffusion required to mediate the rising phase of IPSCs. n.s., p > 0.05; *p < 0.05; ***p < 0.001; error bars indicate ± SEM.

Similar articles

Cited by

References

    1. Aghajanian GK, Bunney BS. Dopamine “autoreceptors”: pharmacological characterization by microiontophoretic single cell recording studies. Naunyn Schmiedebergs Arch Pharmacol. 1977;297:1–7. doi: 10.1007/BF00508803. - DOI - PubMed
    1. Agnati LF, Guidolin D, Guescini M, Genedani S, Fuxe K. Understanding wiring and volume transmission. Brain Res Rev. 2010;64:137–159. doi: 10.1016/j.brainresrev.2010.03.003. - DOI - PubMed
    1. Arnth-Jensen N, Jabaudon D, Scanziani M. Cooperation between independent hippocampal synapses is controlled by glutamate uptake. Nat Neurosci. 2002;5:325–331. doi: 10.1038/nn825. - DOI - PubMed
    1. Balakrishnan V, Kuo SP, Roberts PD, Trussell LO. Slow glycinergic transmission mediated by transmitter pooling. Nat Neurosci. 2009;12:286–294. doi: 10.1038/nn.2265. - DOI - PMC - PubMed
    1. Barbour B, Häusser M. Intersynaptic diffusion of neurotransmitter. Trends Neurosci. 1997;20:377–384. doi: 10.1016/S0166-2236(96)20050-5. - DOI - PubMed

Publication types

LinkOut - more resources