. 2014 May 30:5:4000.
doi: 10.1038/ncomms5000.

Generation of organized germ layers from a single mouse embryonic stem cell

Affiliations
Free PMC article

Generation of organized germ layers from a single mouse embryonic stem cell

Yeh-Chuin Poh et al. Nat Commun. .
Free PMC article

Abstract

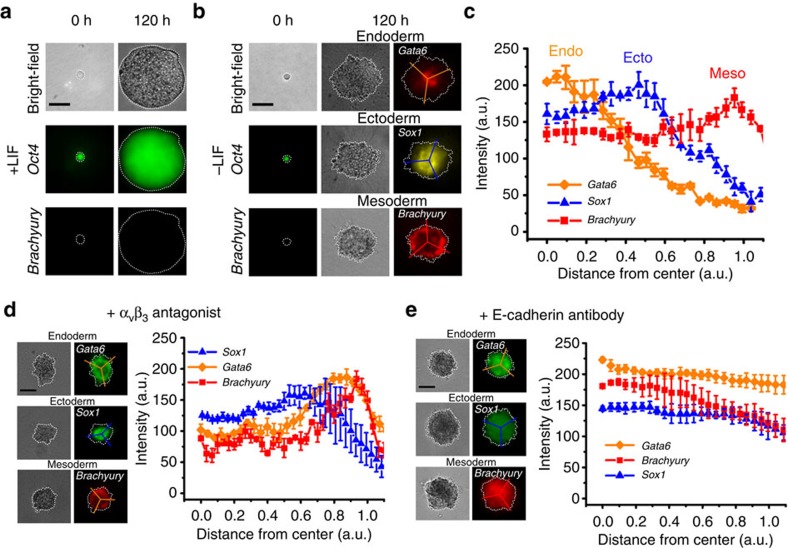
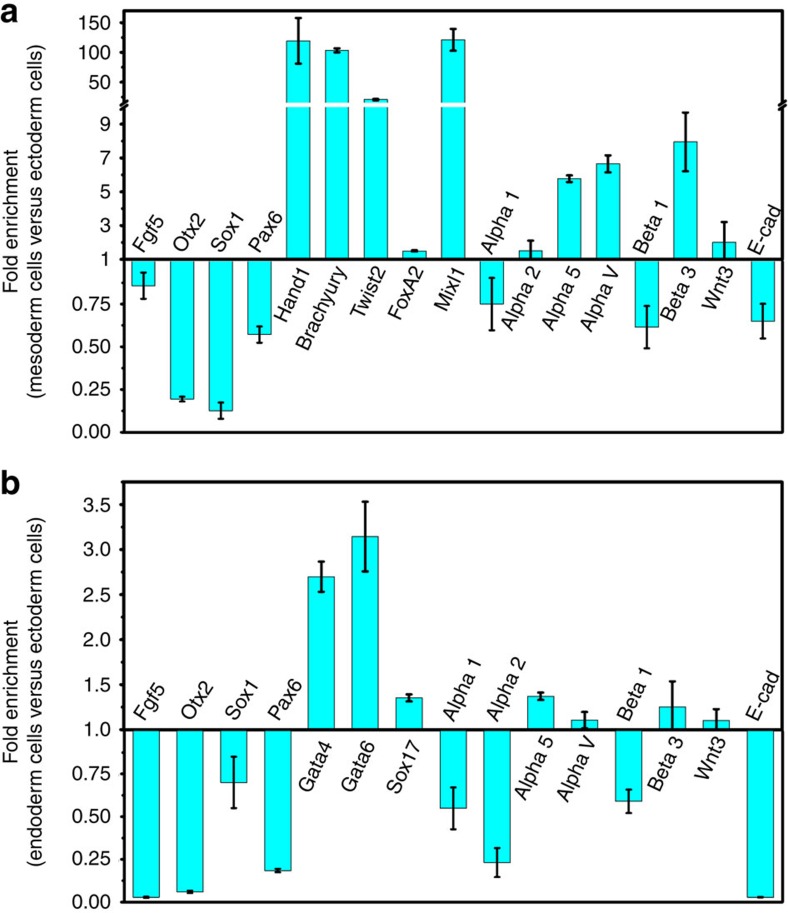
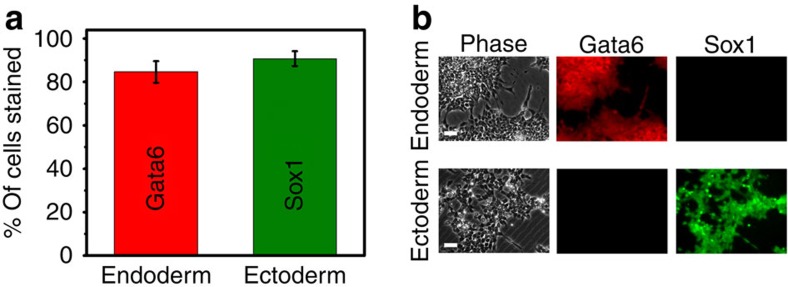
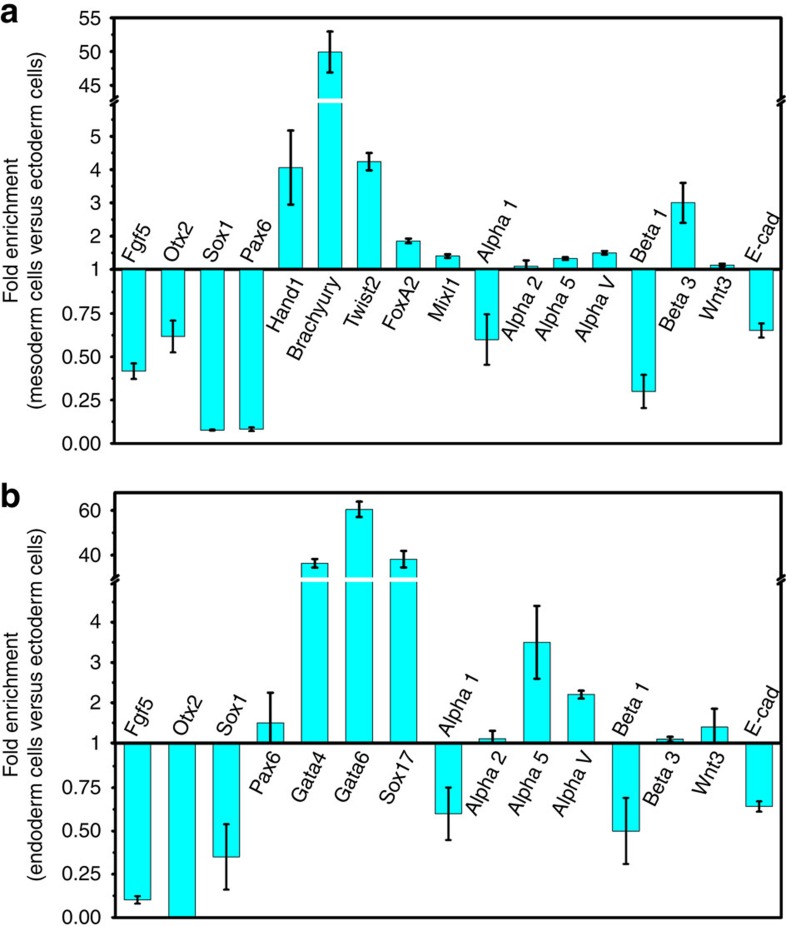
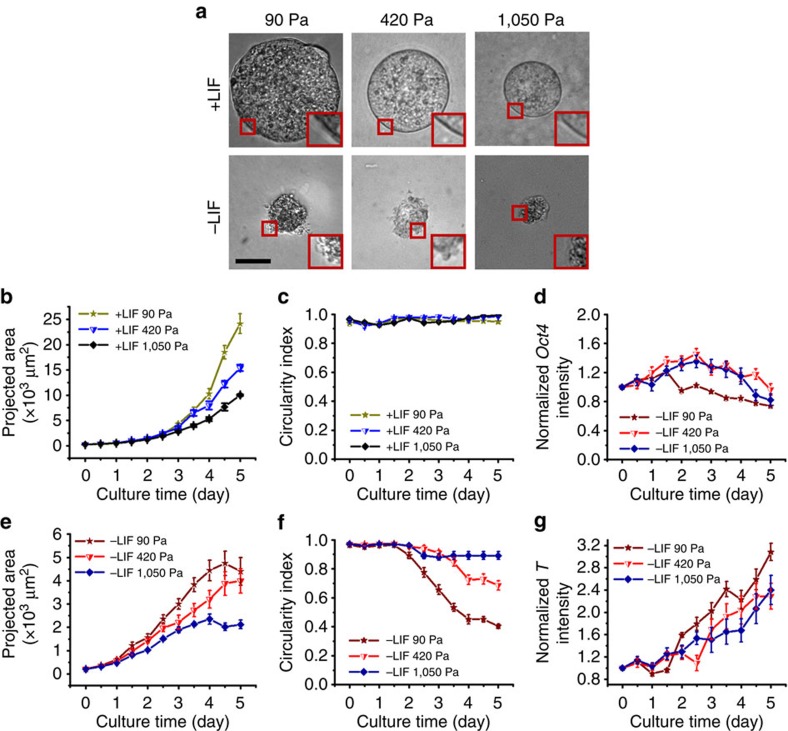
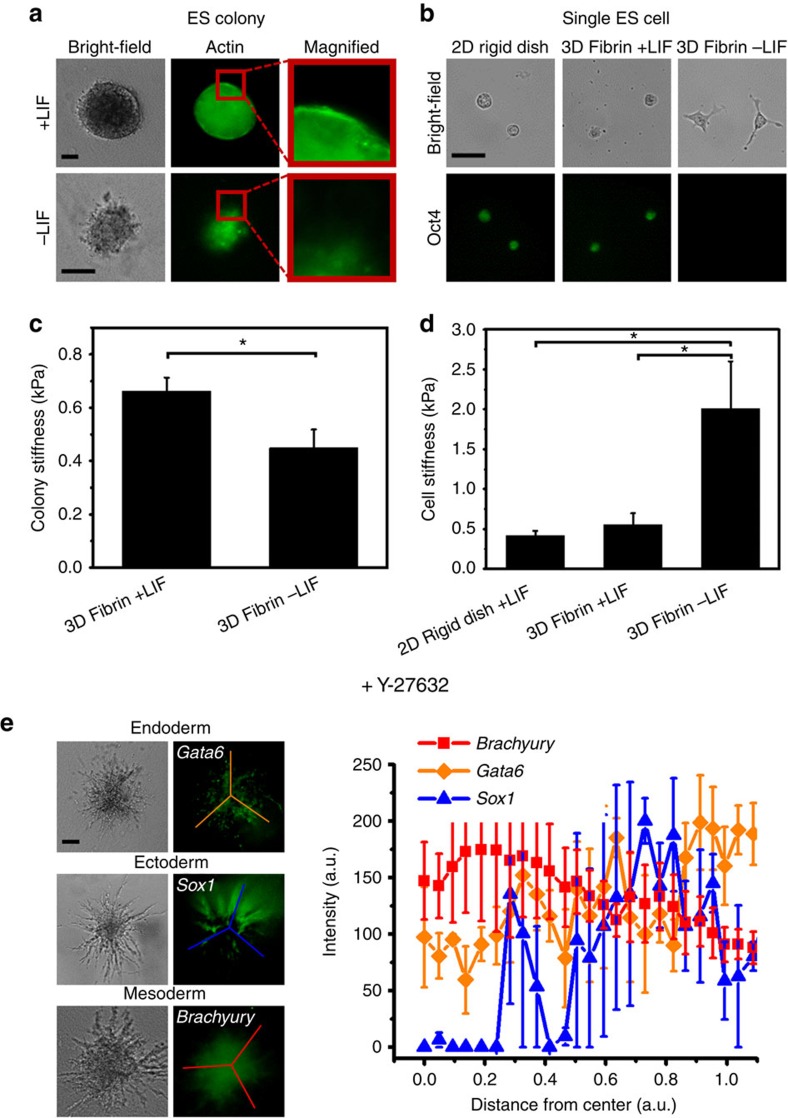
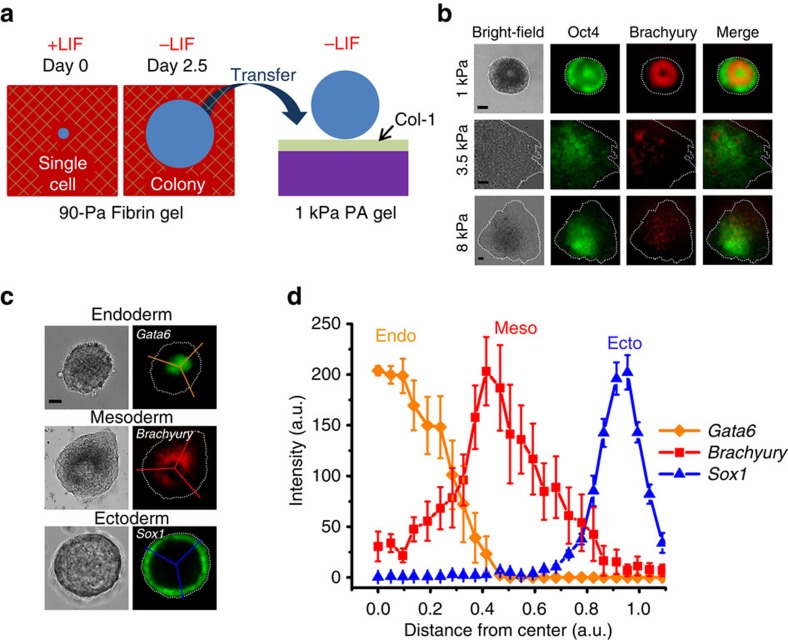
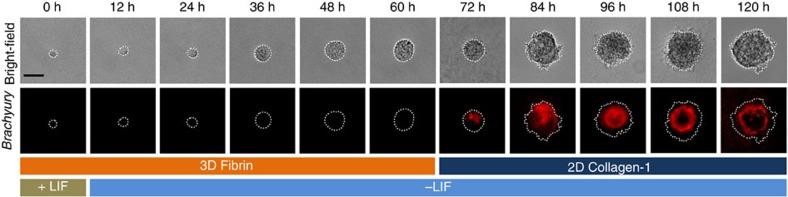
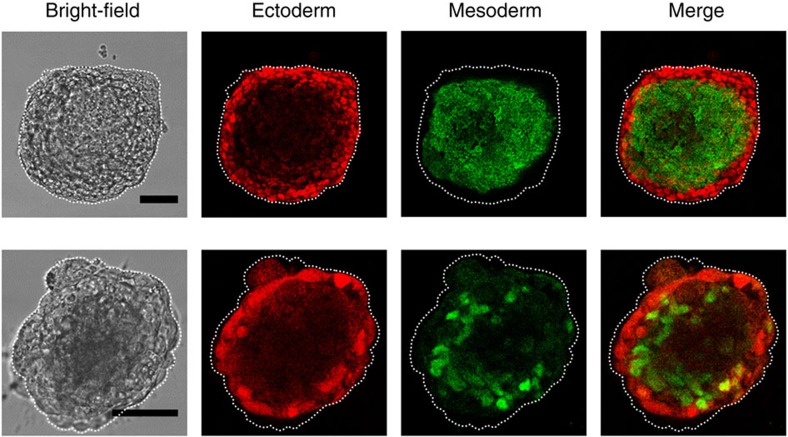
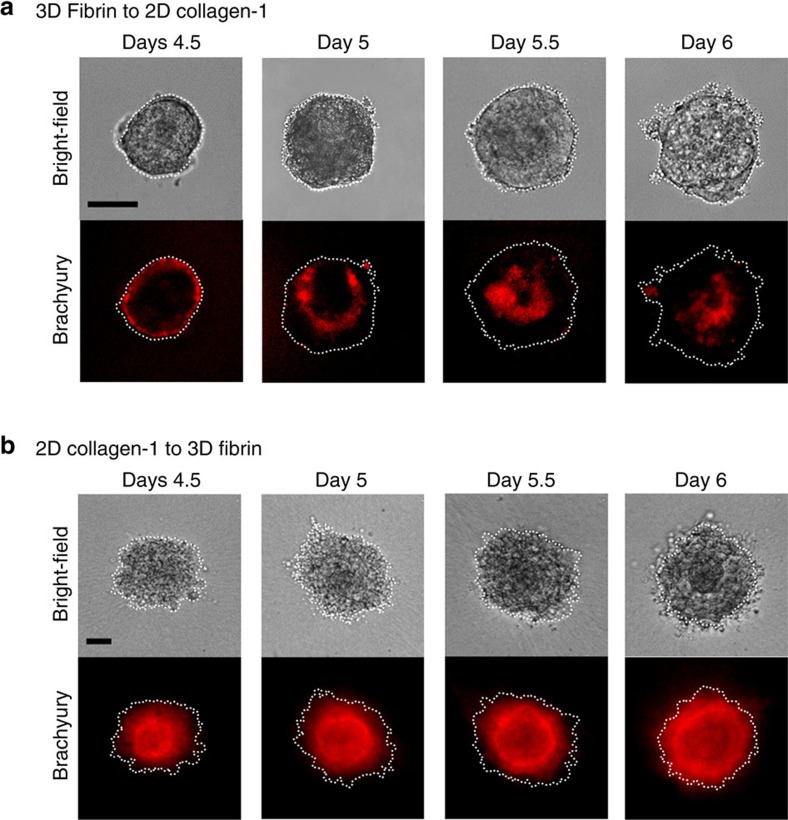
Mammalian inner cell mass cells undergo lineage-specific differentiation into germ layers of endoderm, mesoderm and ectoderm during gastrulation. It has been a long-standing challenge in developmental biology to replicate these organized germ layer patterns in culture. Here we present a method of generating organized germ layers from a single mouse embryonic stem cell cultured in a soft fibrin matrix. Spatial organization of germ layers is regulated by cortical tension of the colony, matrix dimensionality and softness, and cell-cell adhesion. Remarkably, anchorage of the embryoid colony from the 3D matrix to collagen-1-coated 2D substrates of ~1 kPa results in self-organization of all three germ layers: ectoderm on the outside layer, mesoderm in the middle and endoderm at the centre of the colony, reminiscent of generalized gastrulating chordate embryos. These results suggest that mechanical forces via cell-matrix and cell-cell interactions are crucial in spatial organization of germ layers during mammalian gastrulation. This new in vitro method could be used to gain insights on the mechanisms responsible for the regulation of germ layer formation.


Figures

Figure 1
Figure 1. Soft fibrin gels promote organization of germ layers.
(a) Representative bright-field (top) and fluorescence (middle and bottom) images of a single ESC cultured in soft 3D fibrin gels in the presence of LIF (0 h) that formed a round spherical colony in 5 days (120 h). Strong EGFP fluorescence was observed (middle, ‘Oct4’), whereas no DsRed fluorescence was observed (bottom, ‘Brachyury’). (b) Representative images of a single ESC cultured in soft fibrin gels without LIF (0 h, the bright-field image is on the top and the fluorescence images on the middle and bottom, left column) that formed a colony with organized germ layers in 5 days (middle and left columns). Middle: bright-field images of colonies grown from three single cells; right: the presence of endo- and ectodermal cells was detected by immunofluorescence microscopy using anti-Gata6 and Sox1 antibodies, respectively, whereas DsRed fluorescence indicated the differentiation of mesodermal cells (Brachyury). Lines were used to acquire the fluorescence intensity data shown in (c). (c) Quantification of germ layer organization along with 0 (at the centre core) and 1 (at the colony boundary) arbitrary unit (a.u.) based on lines drawn on the fluorescence images on the left in (b). Mean±s.e.m. (d) Representative bright field (left) and fluorescence (middle) images and quantification of different germ layer markers (Sox1, Gata6 and Brachyury) 5 days after αvβ3 antagonist treatment (right). Single ES cells were treated with 20 μg ml−1 of αvβ3 antagonist for 5 days in −LIF medium. Note that the endoderm layer was located at the outer periphery of the colony. Mean±s.e.m. (e) Representative bright-field (left) and fluorescence (middle) images in –LIF condition 5 days after anti-E-cadherin antibody (2 μg ml−1 final concentration) treatment to block E-cadherin–E-cadherin adhesion. Germ layer organization was completely blocked. Quantification of different germ layer markers is shown on the right. Mean±s.e.m.; similar biological replicates of immunofluorescence staining were obtained from at least three independent experiments for each subfigure. W4 cells were used in all figures except for a and the mesoderm layer in b where OGTR1 cells were used. Scale bars, 50 μm.
Figure 2
Figure 2. Real-time qRT–PCR of different germ layers.
Differentiated colonies from soft fibrin gels were extracted and cells of each germ layer were isolated using FACS sorting. (a) Mesoderm cells are compared with ectoderm cells. Expression of mesoderm markers: Hand1, Brachyury, Twist2, FoxA2 and Mixl1 were higher (P<0.007, P<0.002, P<0.003, P<0.026 and P<0.012). Ectoderm markers such as Fgf5, Otx2, Sox1 and Pax6 were significantly lower (P<0.041, P<0.001, P<0.003 and P<0.012). Mesoderm cells express high levels of α5, αv, and β3 integrin (P<0.002, P<0.008 and P<0.039). No significant difference was observed for α2 integrin (P=0.31) and Wnt3 expression (P=0.62). Mean±s.e.m. n=3 independent experiments. (b) Endoderm cells are compared with ectoderm cells. Endoderm markers such as Gata4, Gata6 and Sox17 were highly expressed (P<0.010, P<0.031 and P<0.003), whereas ectoderm markers Fgf5, Otx2, Sox1 and Pax6 were significantly lower (P<0.001, P<0.001, P<0.044 and P<0.001). Endoderm cells express high levels of α5 integrin (P<0.008). No significant difference was observed for αv integrin (P=0.21), β3 integrin (P=0.38) and Wnt3 expression (P=0.19). These data suggest that ectoderm cells not only express high levels of α1β1 integrin but also high levels of E-cadherin. Mean±s.e.m.; n=3 independent experiments.
Figure 3
Figure 3. Ectoderm and endoderm cells induced by exogenous chemical factors.
(a) ESCs were differentiated with ActivinA (100 ng ml−1) or with retinoic acid (5 μM). Cells were then immunofluorescently labelled and the percentage of the stained cells was quantified using a haemocytometer. About 83% of the cells treated with ActivinA were Gata6–labelled, whereas ~90% of the cells treated with retinoic acid were Sox1-labelled; n=6 separate counts for each marker. (b) Representative phase contrast (left column), Gata6 (middle column) and Sox1 immunofluorescence images (right column) of endoderm (top row) and ectoderm (bottom row) cells. ESCs that were differentiated by ActivinA or by retinoic acid were each stained for Sox1 and Gata6. ActivinA-treated cells are stained only by Gata6 (endoderm marker), whereas retinoic acid-treated cells are stained only by Sox1 (ectoderm marker). Real-time qRT–PCRs of these chemically differentiated cells are shown in Fig. 4. Scale bars, 50 μm.
Figure 4
Figure 4. Real-time qRT–PCR of different germ layers induced by exogenous chemical factors.
Chemically differentiated ectoderm and endoderm cells were analysed to verify whether they are bona fide. (a) Mesoderm cells are compared with ectoderm cells. Expression of mesoderm markers: Hand1, Brachyury, Twist2, FoxA2 and Mixl1 were higher (P<0.04, P<0.004, P<0.006, P<0.007 and P<0.02). Ectoderm markers such as Fgf5, Otx2, Sox1 and Pax6 were significantly lower (P<0.006, P<0.03, P<0.001 and P<0.001). Mesoderm cells express high levels of α5, αv and β3 integrin (P<0.015, P<0.008 and P<0.041). No significant difference was observed for α2 integrin (P=0.61) and Wnt3 expression (P=0.35). Mean±s.e.m. n=3 independent experiments. (b) Endoderm cells are compared with ectoderm cells. Endoderm markers such as Gata4, Gata6 and Sox17 were highly expressed (P<0.003, P<0.004 and P<0.01), whereas ectoderm markers Fgf5, Otx2 and Sox1 were significantly lower (P<0.001, P<0.001 and P<0.001). Endoderm cells express high levels of α5 and αv integrin (P<0.047, P<0.002). No significant difference was observed for Pax6 (P=0.38), α2 integrin (P=0.21), β3 integrin (P=0.1) and Wnt3 expression (P=0.48). These verify that ectoderm cells express high levels of E-cadherin and α1β1 collagen-1 binding integrin. Mean±s.e.m.; n=3 independent experiments.
Figure 5
Figure 5. Matrix softness influences ES cell growth and differentiation.
(a) Bright-field images of mESC colonies after 5 days of culture (grown from a single ESC) in 3D fibrin gels of different stiffness. Insets are magnified colony peripheries showing the surface roughness. Scale bar, 50 μm. (b) Summarized results of colony sizes in the presence of LIF (+LIF). (c) Circularity index in +LIF conditions. The circularity index is a measure of the roundedness of a colony. (d) Normalized EGFP intensity as a function of culture time in the absence of LIF (–LIF). (e) Projected areas as a function of culture time. (f) Circularity index in –LIF conditions. (g) Normalized DsRed intensity in –LIF conditions. Mean±s.e.m.; n=15 colonies for each condition in bg. Data pooled from >3 independent experiments. OGTR1 cells were used to obtain the results of all figures.
Figure 6
Figure 6. Colony tension impacts germ layer organization.
(a) Left: bright-field images of the colonies; middle: F-actin staining of the colony in the left; right: magnified areas of the boxes in the middle, showing much more F-actin in +LIF condition than in –LIF condition. (b) Representative bright-field (top) and fluorescence (bottom) images of individual cells (isolated from colonies maintained under conditions indicated on the top) on 2D rigid substrates. (c) Colony stiffness was measured after 5 days of culture for each isolated intact colony. Mean±−s.e.m.; n=84 for +LIF; n=80 for –LIF. (d) Individual cell stiffness. Individual cells were re-plated on 2D rigid substrate for 6 h before stiffness measurements were carried out. Mean±s.e.m.; n=28 for 2D rigid dish +LIF; n=53 for 3D fibrin +LIF; n=27 for 3D fibrin –LIF. (e) Representative bright field (left) and fluorescence (middle) images of the colonies treated with ROCK inhibitor Y27632 (25 μM) for 5 days (note that germ layers became disorganized and colonies exhibited extensive dendritic morphology); quantification of different germ layer markers is shown on the right. Mean±s.e.m. Similar results of immunofluorescence staining were obtained from at least three independent experiments for each subfigure. Scale bar, 50 μm. (*, P<0.023). OGTR1 cells were used in all subfigures except in a and e where W4 cells were used.
Figure 7
Figure 7. Generation of three germ layer organization.
(a) Schematic of the experimental protocol. A single OGTR1 ESC was grown in 3D 90-Pa fibrin gel in the presence of LIF (+LIF) for the first 11 h before switching to –LIF condition. At day 2.5, the individual colony is transferred to the top of collagen-1 (Col-1)-coated polyacrylamide gel (PA) of 1-kPa stiffness in the absence of LIF (−LIF). (b) Bright-field (left column) and fluorescence (second, third and right columns) images of ESC colonies maintained under conditions indicated on the left show positioning of a mesoderm layer (a DsRed-Brachyury expressing, donut-like ring) in the middle of the colony on top of Col-1-coated PA gels. Note that only on 1-kPa PA gels, the colony generated a mesodermal layer in the middle of the colony; spread colonies with randomly positioned mesodermal cells were found on stiffer substrates. EGFP is still expressed in the colony, suggesting that at this stage the colony is in transition between pluripotency and multipotency. (c) Representative bright-field (left) and fluorescence (right) images of colonies at day 5, after being transferred from 3D fibrin to 2D collagen-1 PA as described in (a). Endo- and ectodermal cells were stained by immunofluorescence microscopy using anti-Gata6 and Sox1 antibodies, respectively, whereas DsRed fluorescence indicated the differentiation of mesodermal cells (Brachyury). Lines were used to acquire the fluorescence intensity data shown in (d). (d) Quantification of germ cell organization as described in Fig. 1c. Self-organized germ layers were properly replicated with endoderm at the core, mesoderm in the middle and ectoderm at the periphery. Mean±s.e.m.; at least three independent experiments showing similar results. Scale bar, 50 μm. The efficiency of Gata6-positive (endoderm) cells exclusively in the inner layer and the efficiency of Brachyury-positive (mesoderm) cells exclusively in the middle layer of the embryoid colony are ~50% (50 out of every 100 transferred colonies; >500 colonies quantified). The efficiency of Sox1-positive (ectoderm) cells exclusively in the outer layer of the embryoid colony is ~5% (5 out of every 100 colonies; >300 colonies were quantified). The efficiency of generating all three germ layers in the correct positioning is 2.6±0.28% (mean±s.e.m.; from nine separate experiments). In contrast, no proper positioning of any type of germ layer cells was found (0 out of 1,000 colonies) in the embryoid colonies when they were transferred to fibronectin-coated 2D PA substrates of 1  kPa (Supplementary Fig. 13). OGTR1 cells were used in all subfigures except the staining of endoderm and ectoderm in (c).
Figure 8
Figure 8. Time course of formation of Brachyury-positive mesodermal middle layer.
As described in Fig. 7a, A single OGTR1 ESC was grown in 3D 90-Pa fibrin gel in +LIF condition for the first 11 h before switching to –LIF condition. After 60 h, the individual colony is transferred to the top of collagen-1-coated polyacrylamide gel in the absence of LIF. The Brachyury-positive cells were observed to localize or segregate at one end of the colony before sorting into a distinct middle mesodermal layer after 84 h. About 50% of the cells (out of 50 single ESCs) from >3 separate experiments that were tracked from time zero to 120 h showed similar results. Scale bar, 50 μm.
Figure 9
Figure 9. Confocal images of ectoderm and mesoderm germ layers within the same colony.
Representative images of two different colonies with bright field (left column), a distinct Pax6 ectoderm immunofluorescence at the outer layer (2nd column), a distinct Brachyury mesoderm immunofluorescence at the middle layer (3nd column) and merge fluorescence images (right column). Scale bar, 50 μm. From these staining data and those staining data of the colonies in the movies, assuming individual cells from each germ layer have the same volume, we estimate that endoderm, mesoderm and ectoderm layer cells are ~5%, 60% and 35% of the total cells, respectively. These results are representatives of >3 experimental replicates.
Figure 10
Figure 10. Self-organization of the embryoid colony is due to differential adhesion of germ layer cells.
(a) A single ESC was cultured in 3D soft fibrin gels in the absence of LIF. When Brachyury-positive cells were distinctly observed at the outer layer at 4.5 days, the gel was dissolved and colonies transferred to 2D collagen-1-coated PA gel. The Brachyury-positive outer layer was observed to move inwards to the middle layer by day 6. (b) As described in Fig. 7a, ESCs were first cultured in 3D soft fibrin gels before being transferred to 2D collagen-1-coated PA gel after 60 h. At day 4.5 when Brachyury-positive cells were distinctly expressed at the middle layer, the colonies were encapsulated with 3D soft fibrin gel. The Brachyury-positive middle layer was observed to move outwards to the outer layer by day 6. These results suggest that the colony self-organizes on the basis of preferential binding of mesodermal cells to fibrin and ectodermal cells to collagen-1. Scale bar, 50 μm. These results are representative of >3 experimental replicates.

References

    1. Desprat N., Supatto W., Pouille P., Beaurepaire E. & Farge E. Tissue deformation modulates twist expression to determine anterior midgut differentiation in Drosophila embryos. Dev. Cell 15, 470–477 (2008). - PubMed
    1. Rauzi M., Verant P., Lecuit T. & Lenne P. Nature and anisotropy of cortical forces orienting Drosophila tissue morphogenesis. Nat. Cell Biol. 10, 1401–U57 (2008). - PubMed
    1. Roh-Johnson M. et al. Triggering a cell shape change by exploiting preexisting actomyosin contractions. Science 335, 1232–1235 (2012). - PMC - PubMed
    1. Behrndt M. et al. Forces driving epithelial spreading in zebrafish gastrulation. Science 338, 257–260 (2012). - PubMed
    1. Weber G. F., Bjerke M. A. & DeSimone D. W. A mechanoresponsive cadherin-keratin complex directs polarized protrusive behavior and collective cell migration. Dev. Cell 22, 104–115 (2012). - PMC - PubMed

Publication types

LinkOut - more resources