

Finding novel molecular connections between developmental processes and disease
- PMID: 24874013
- PMCID: PMC4038461
- DOI: 10.1371/journal.pcbi.1003578
Finding novel molecular connections between developmental processes and disease
Abstract
Identifying molecular connections between developmental processes and disease can lead to new hypotheses about health risks at all stages of life. Here we introduce a new approach to identifying significant connections between gene sets and disease genes, and apply it to several gene sets related to human development. To overcome the limits of incomplete and imperfect information linking genes to disease, we pool genes within disease subtrees in the MeSH taxonomy, and we demonstrate that such pooling improves the power and accuracy of our approach. Significance is assessed through permutation. We created a web-based visualization tool to facilitate multi-scale exploration of this large collection of significant connections (http://gda.cs.tufts.edu/development). High-level analysis of the results reveals expected connections between tissue-specific developmental processes and diseases linked to those tissues, and widespread connections to developmental disorders and cancers. Yet interesting new hypotheses may be derived from examining the unexpected connections. We highlight and discuss the implications of three such connections, linking dementia with bone development, polycystic ovary syndrome with cardiovascular development, and retinopathy of prematurity with lung development. Our results provide additional evidence that TGFB lays a key role in the early pathogenesis of polycystic ovary syndrome. Our evidence also suggests that the VEGF pathway and downstream NFKB signaling may explain the complex relationship between bronchopulmonary dysplasia and retinopathy of prematurity, and may form a bridge between two currently-competing hypotheses about the molecular origins of bronchopulmonary dysplasia. Further data exploration and similar queries about other gene sets may generate a variety of new information about the molecular relationships between additional diseases.
Conflict of interest statement
The authors have declared that no competing interests exist.
Figures
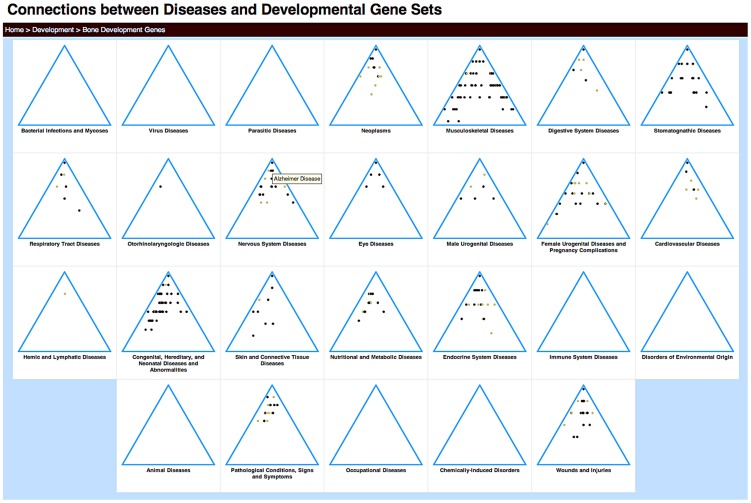
 , and darker brown dots,
  . Mousing over the dots reveals a pop-up of the disease term associated with that node (Alzheimer Disease is shown). Clicking on the category name leads to a detailed view of that tree.
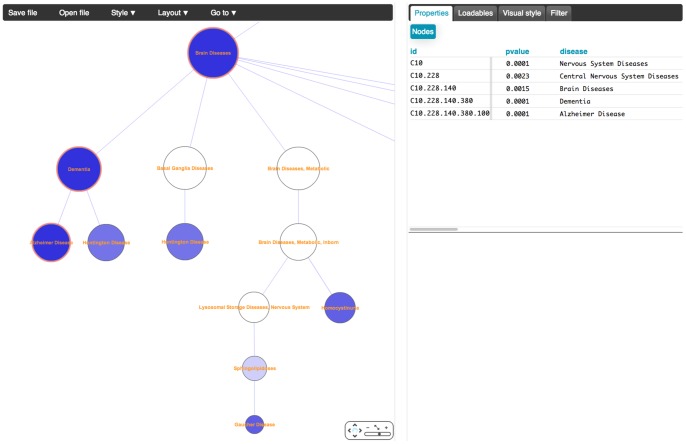
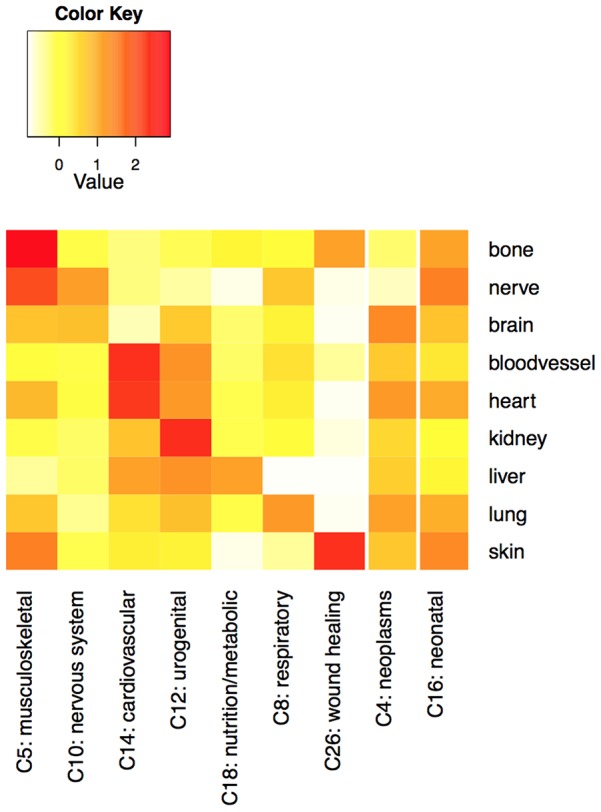
 ) of genes in the indicated gene set. Expected connections appear approximately along the diagonal in the first 7 columns, and throughout the rightmost two columns.
 and
and  for the
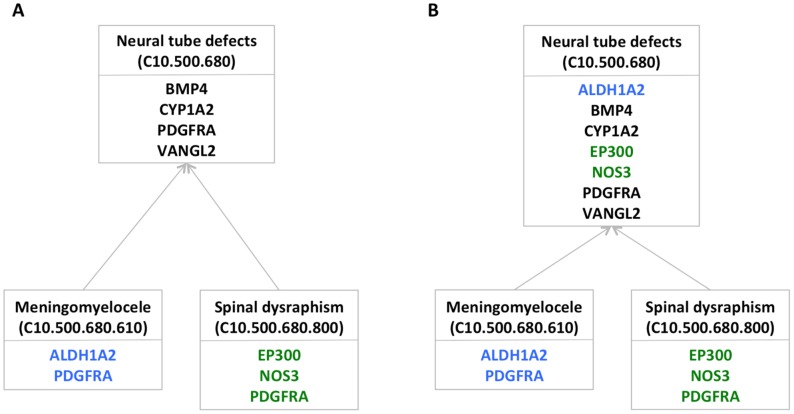
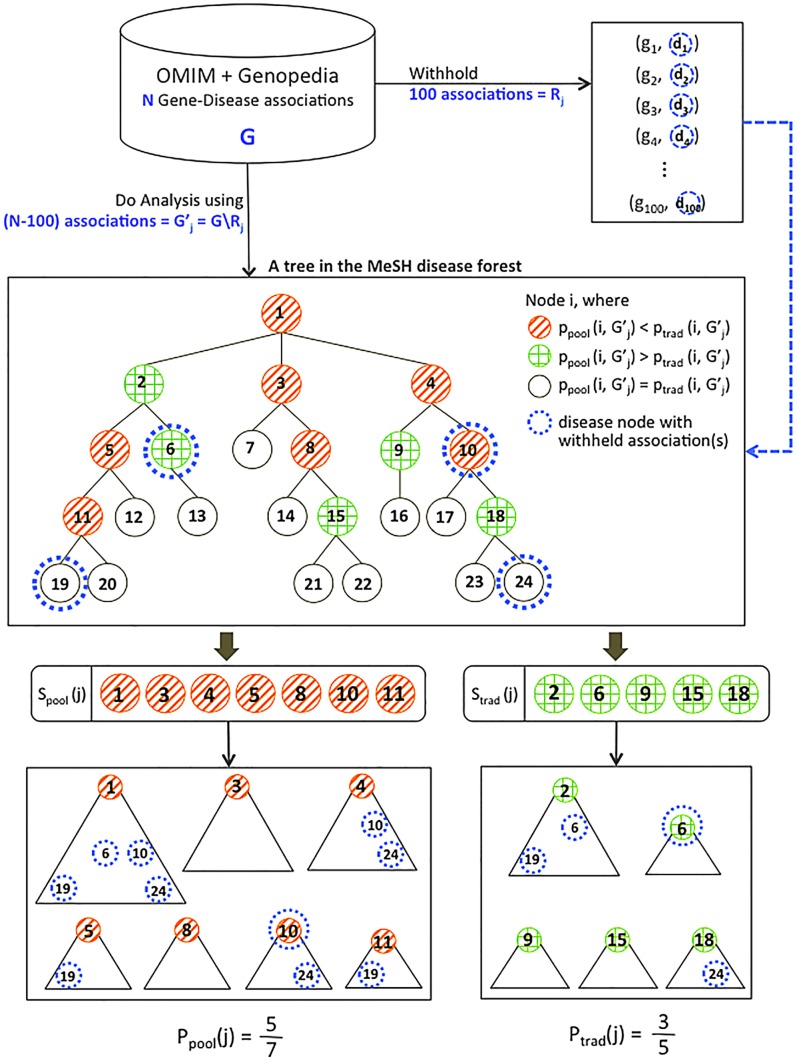
  th random trial. 100 gene-disease associations involving genes in the query gene set are withheld. Using the remaining associations, p-values for enrichment of the disease gene set at each node are computed using both the traditional and pooling approaches. Nodes are assigned to
  or
or  based on which approach shows more significant enrichment, and the rate at which each set is supported by withheld links is computed. The idea is that if a disease class is correctly linked to the query gene set, it should be more likely to be supported by withheld gene-disease associations from that same query set.
References
-
- Barker D (2003) The developmental origins of adult disease. Eur J Epidemiol 18: 733–6. - PubMed
Publication types
MeSH terms
Substances
Grants and funding
LinkOut - more resources
Full Text Sources
Other Literature Sources
