. 2014 May 29;10(5):e1004162.
doi: 10.1371/journal.ppat.1004162. eCollection 2014 May.

Large scale RNAi reveals the requirement of nuclear envelope breakdown for nuclear import of human papillomaviruses

Affiliations

Large scale RNAi reveals the requirement of nuclear envelope breakdown for nuclear import of human papillomaviruses

Inci Aydin et al. PLoS Pathog. .

Abstract

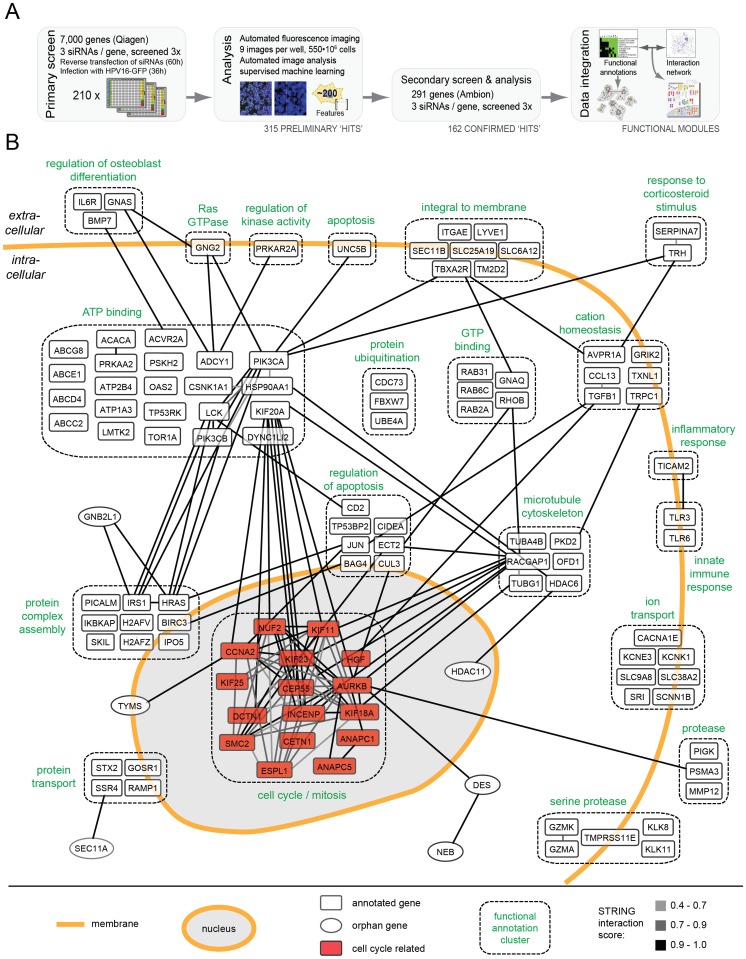
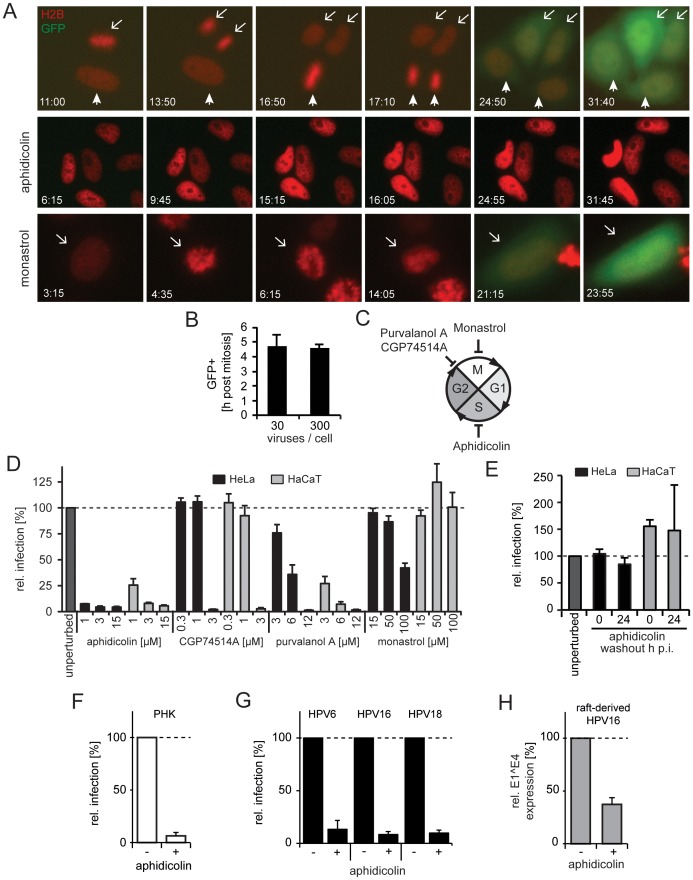
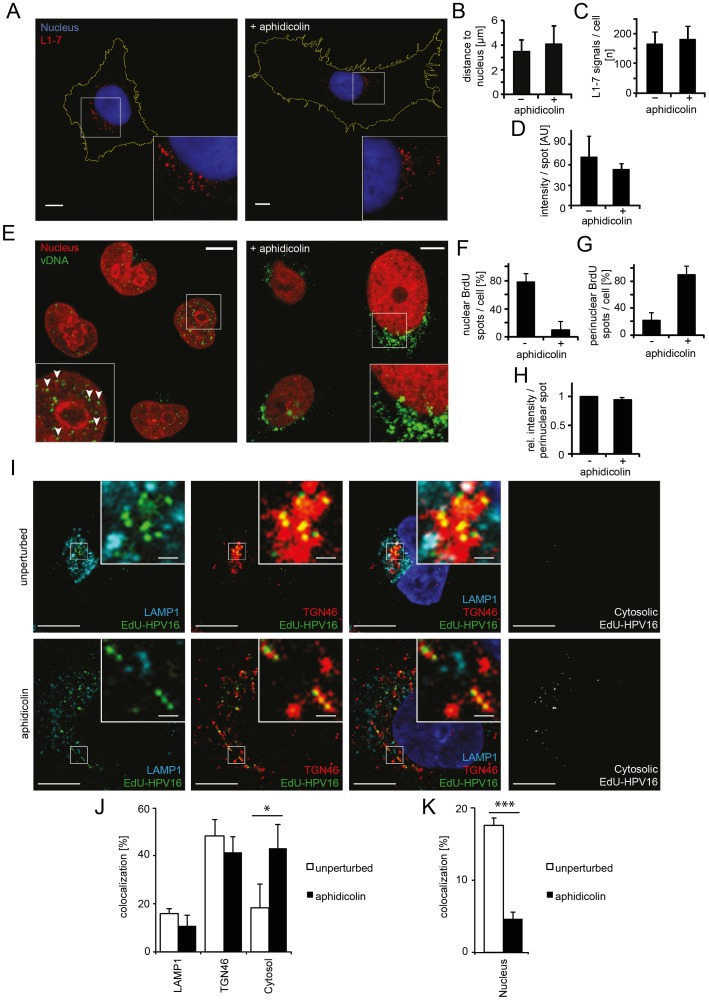
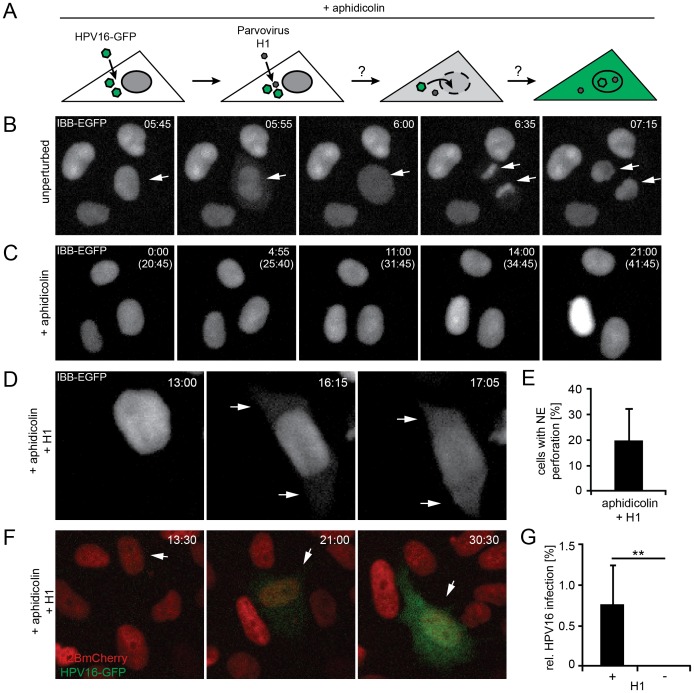
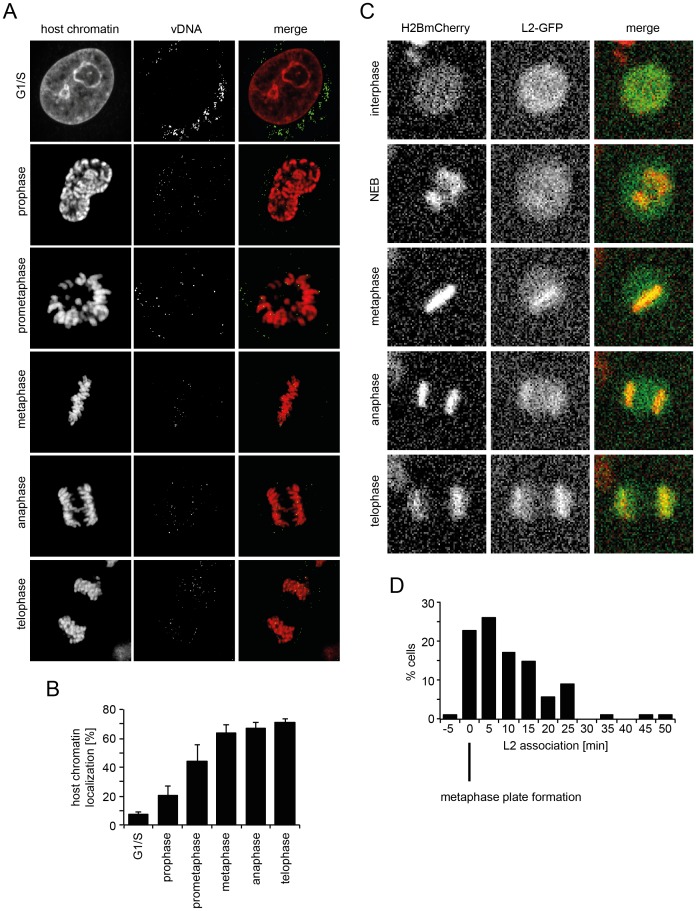
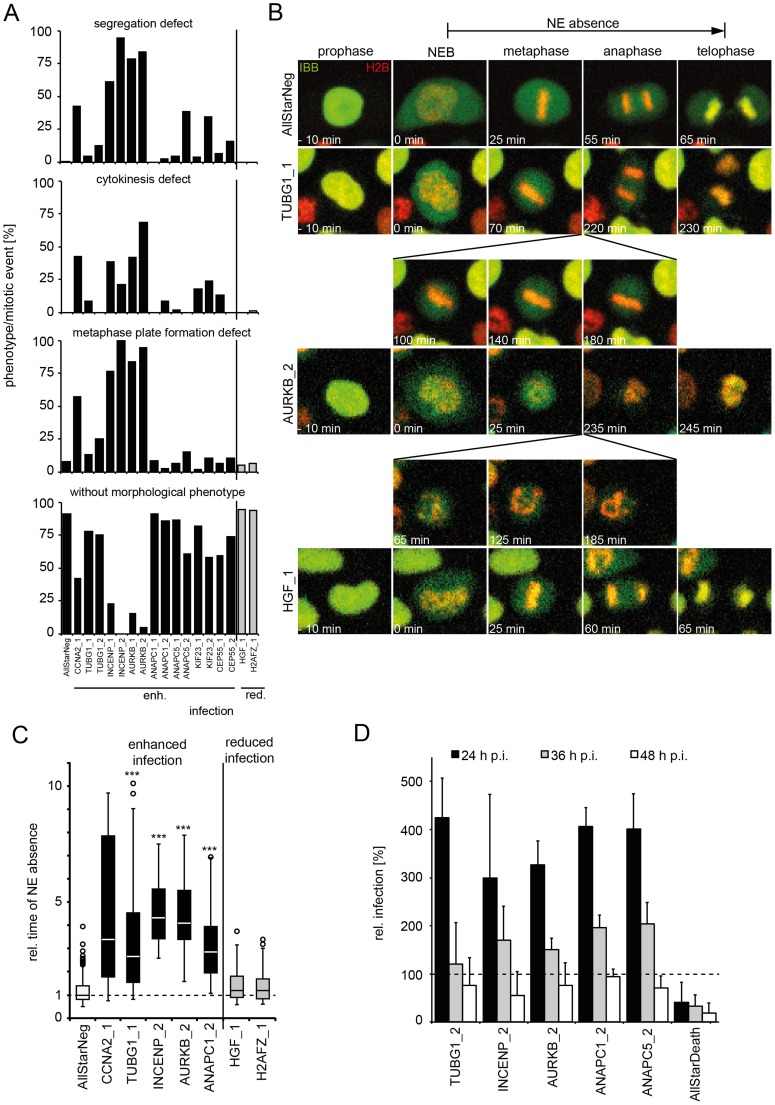
A two-step, high-throughput RNAi silencing screen was used to identify host cell factors required during human papillomavirus type 16 (HPV16) infection. Analysis of validated hits implicated a cluster of mitotic genes and revealed a previously undetermined mechanism for import of the viral DNA (vDNA) into the nucleus. In interphase cells, viruses were endocytosed, routed to the perinuclear area, and uncoated, but the vDNA failed to be imported into the nucleus. Upon nuclear envelope perforation in interphase cells HPV16 infection occured. During mitosis, the vDNA and L2 associated with host cell chromatin on the metaphase plate. Hence, we propose that HPV16 requires nuclear envelope breakdown during mitosis for access of the vDNA to the nucleoplasm. The results accentuate the value of genes found by RNAi screens for investigation of viral infections. The list of cell functions required during HPV16 infection will, moreover, provide a resource for future virus-host cell interaction studies.


Conflict of interest statement

The authors have declared that no competing interests exist.

Figures

Figure 1
Figure 1. HPV16 RNAi screen and map of host cell factors involved in entry.
(A)Outline of the RNAi screening and bioinformatic procedures. (B) 159 hits (by gene symbol) that enhanced or decreased HPV16 infection after silencing were assigned to enriched functional annotation clusters. Functional clusters with simplified annotations are depicted as boxes with dashed outlines (compare Tables S1 and S2). Connecting lines between genes reflect the degree of confidence of interaction (high  =  black, i.e. 0.9–1.0; intermediate  =  dark gray, i.e. 0.7–0.9, low  =  light gray, i.e. 0.4–0.7). The mitosis cluster is highlighted in red.
Figure 2
Figure 2. Cell cycle progression into early mitosis is required for HPV16 entry.
(A) Depicted are images from representative time lapses for untreated (first row), aphidicolin-treated (second row), and monastrol-treated (last row) HeLa H2B-mCherry cells infected with HPV16-GFP (30vge/cell, see also Videos S1–S3). Time stamps (hh:mm) indicate the time after virus addition. Mitoses in untreated cells are marked by arrows/arrowheads. Note that monastrol-treated cells failed to separate chromosomes but underwent chromosome condensation, aberrant metaphase plate formation, and decondensation of chromosomes (arrows). (B) as in (A). To relate the timing of mitosis and the onset of GFP expression (i.e. successful HPV16 entry), HeLa H2B-mCherry cells were infected with HPV16 (30 and 300 vge/cell), and cells were imaged by time-lapse microscopy. The end of mitosis was defined by visible chromosome decondensation (i.e. telophase), whereas the onset of GFP expression was defined as 10% signal above background. Given is the relative timing of GFP onset post mitosis ± standard deviation (SD). (C) Schematic depiction of the cell cycle. The effects of the inhibitors on cell cycle transitions are indicated. (D) HeLa (black bars) or HaCaT (gray bars) cells were infected with HPV16 PsV after 16 h of preincubation in the presence of inhibitors or solvent control (unperturbed) at indicated concentrations. The number of infected cells was determined 48 h p.i. by flow cytometry. Depicted are infected cells relative to control in percent ± SD. (E) as in (D). To test the reversibility of the S-phase arrest for infection, cells were treated with aphidicolin, and the drug was washed out at the time of HPV16 infection (0 h p.i.) or 24 h p.i.. (F) as in (D) using PHK cells. (G) HeLa cells were infected with HPV6, HPV16, or HPV18 PsV after 16 h preincubation aphidicolin. The number of infected cells was determined 48 h p.i. by flow cytometry. Depicted are infected cells relative to the DMSO treated control in percent ± SD. (H) HaCat cells were infected with raft-derived HPV16 after 16 h preincubation with aphidicolin. Total RNA was extracted 48 h p.i., and infection was measured by the viral splice transcript E1∧E4 normalized to TBP. Infection is depicted relative to the DMSO treated control in percent ± SD.
Figure 3
Figure 3. Nuclear import of HPV16 vDNA is blocked in interphase cells.
(A) Aphidicolin-treated or untreated HeLa cells were infected with HPV16-GFP. At 16 h p.i., cells were fixed and immunostained with the L1-7 antibody detecting endosomal, conformationally altered virions. Depicted are confocal sections of untreated (left) or aphidicolin-treated (right) cells. (B) As in (A) with quantification of the three-dimensional distance of L1-7 signals to the nuclear border (in µm) ± SD. (C) As in (A) with quantification of the number of discernible L1-7 spots/cell. (D) As in (A) with quantification of the fluorescent intensity (in arbitrary units, AU) of individual L1-7 spots. (E) HeLa H2B-mCherry cells were infected with BrdU-HPV16. Cells were immunostained for BrdU to detect the vDNA after fixation at 24 h p.i.. Depicted are confocal sections of aphidicolin-treated (interphase, right) or untreated (left) cells. Mostly, the vDNA localized intranuclearly as discrete spots in untreated cells (arrowheads) or exclusively perinuclearly in aphidicolin-treated cells. (F) As in (E) with quantification of intranuclear BrdU spots/cell. The number of intranuclear spots is given relative to the total number of cellular spots. (G) As in (E) with quantification of perinuclear BrdU spot/cell as in (F). (H) As in (E) with quantification of the signal intensities of individual perinuclear BrdU spots relative to untreated infected cells. (I) HeLa cells were treated with or without aphidicolin for 16 h prior to infection. 20 h after infection with EdU-HPV16 (green), cells were fixed and immunostained for TGN46 (red) and LAMP1 (light blue). The nucleus was stained by Hoechst (dark blue). Depicted are single confocal sections. The cytosolic EdU-HPV16 signal is depicted after substraction of the EdU-HPV16 signals colocalizing with LAMP1, TGN46 and the nucleus. (J) As (I) with quantification of signal colocalization of EdU-HPV16 with LAMP1 or TGN46. Cytosolic EdU-HPV16 amounts were defined as signals that did not colocalize with LAMP1, TGN46, or the nucleus (see below). (K) As in (I) with quantification of signal colocalization of EdU-HPV16 with the nuclear stain (Hoechst). Statistical significance was determined by a two-tailed, independent t-test; P-values: * <0.05; *** <0.001. All scale bars: 10 µm.
Figure 4
Figure 4. Nuclear envelope perforation allows HPV16 entry in interphase cells.
(A) Schematic depiction of the experimental setup. Aphidicolin-treated cells were infected (loaded) with HPV16, after which they were superinfected with parvovirus H1. (B) Time-lapse images of HeLa IBB-GFP cells (see Video S5). Arrowheads indicate mitotic events, during which the IBB-GFP signal dispersed throughout the cytosol after NEB. Indicated is the time after image acquisition was started. (C) As in (B) of cells treated with aphidicolin. Indicated are the times after image acquisition was started and, in brackets, after aphidicolin was added (see Video S6). (D) As in (C) with addition of parvovirus H1. Timestamps indicate the time after H1 addition. Note the translocation of the IBB-GFP signal into the cytosol (arrows, see Video S7). (E) Quantification of video microscopy from (D). Depicted is the relative number of cells exhibiting IBB-GFP translocation to the cytosol (NE perforation by H1) ± SD (18 fields of view/experiment) (F) HeLa H2B-mCherry cells were treated with aphidicolin for 16 h, when cells were infected with HPV16 PsV. 12 h post HPV16 infection, cells were superinfected with parvovirus H1, and time-lapse recording was started. Depicted are images from a representative time lapse (see Video S8). Time stamps indicate the time after H1 addition. (G) Quantification of video microscopy from (F) with or without H1 addition. Depicted are the numbers of infected cells in percent ± SD (n = 350 cells/experiment). Statistical significance was determined by a one-tailed, independent t-test: P-value **<0.002.
Figure 5
Figure 5. vDNA and L2-GFP associate with mitotic chromosomes.
(A) HeLa Kyoto cells were infected with EdU-HPV16. Cells were stained for host DNA and EdU to detect the vDNA after fixation at 20 h p.i.. Depicted are host cell chromatin (left), the vDNA (middle), and merge (right) of confocal sections of an aphidicolin-treated cell (G1/S) and untreated mitotic cells. Note that vDNA commenced association with chromosomes upon entry into mitosis. Indicated are the mitotic stages based on chromosomal organization. (B) as in (A). Quantification of vDNA localization to host chromatin ± SD (n = 5). (C) HeLa H2B-mCherry cells were transiently transfected with an L2-GFP expression plasmid. Cells were imaged by video microscopy 32 h post transfection for 24 h in 5 min intervals. Depicted are images of a L2-GFP expressing cell progressing through mitosis (from Video S9). (D) Timing of L2-GFP chromosomal association relative to metaphase plate formation (n = 88).
Figure 6
Figure 6. Mitotic regulators that enhance HPV16 infection exhibit prolonged mitoses upon RNAi.
HeLa H2B-mRFP/IBB-GFP cells were reverse transfected with the indicated siRNAs (see also Table S4). (A) Cells were imaged by video microscopy 48 h post transfection for 24 h in 5 min intervals. Mitotic events after RNAi were assigned to one or more morphological phenotypes such as defects in metaphase plate formation, chromosome segregation, cytokinesis, or designated without morphological phenotype (from top to bottom). (B) Time-lapse images of representative cells from (A). Mitotic progression is depicted for cells after RNAi of TUBG1 (2nd row, see Video S11), AURKB (3rd row, see Video S12), HGF (4th row, see Video S13) or control (AllStar Neg., 1st row, see Video S10). (C) The timing from NEB until telophase (i.e. nuclear accumulation of IBB-GFP) was used to define the time of NE absence. Relative times of NE absence are presented as boxplots with outliers (circles). Statistical significance was determined by a one-tailed, independent, heteroscedastic t-test; ***: p-value <0.001. (D) 48 h after reverse transfection of indicated siRNAs, cells were infected with HPV16-GFP, and infection was scored at 24 h, 36 h, and 48 hpi by automated microscopy and computational image analysis. Depicted is the infection relative to AllStarNeg control in percent ± SD.

Similar articles

Cited by

References

    1. Doorbar J, Quint W, Banks L, Bravo IG, Stoler M, et al. (2012) The biology and life-cycle of human papillomaviruses. Vaccine 30 Suppl 5 F55–70. - PubMed
    1. Bosch FX, de Sanjose S (2003) Chapter 1: Human papillomavirus and cervical cancer—burden and assessment of causality. J Natl Cancer Inst Monogr (31): 3–13. - PubMed
    1. Schiller JT, Castellsague X, Garland SM (2012) A review of clinical trials of human papillomavirus prophylactic vaccines. Vaccine 30 Suppl 5 F123–138. - PMC - PubMed
    1. Buck CB, Cheng N, Thompson CD, Lowy DR, Steven AC, et al. (2008) Arrangement of L2 within the Papillomavirus capsid. J Virol 82: 5190–5197. - PMC - PubMed
    1. Buck CB, Pastrana DV, Lowy DR, Schiller JT (2004) Efficient intracellular assembly of papillomaviral vectors. J Virol 78: 751–757. - PMC - PubMed