. 2014 May 29;10(5):e1004171.
doi: 10.1371/journal.ppat.1004171. eCollection 2014 May.

A new class of multimerization selective inhibitors of HIV-1 integrase

Affiliations

A new class of multimerization selective inhibitors of HIV-1 integrase

Amit Sharma et al. PLoS Pathog. .

Abstract

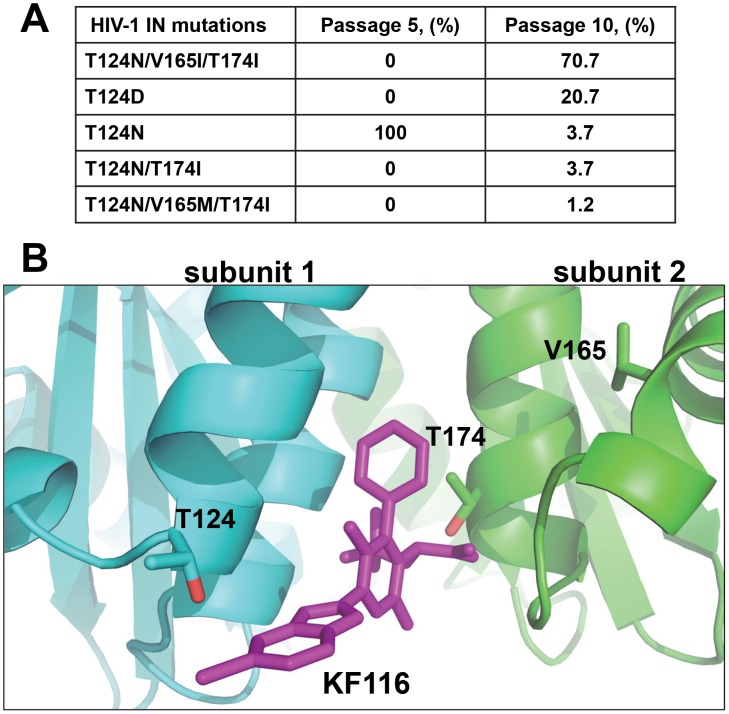
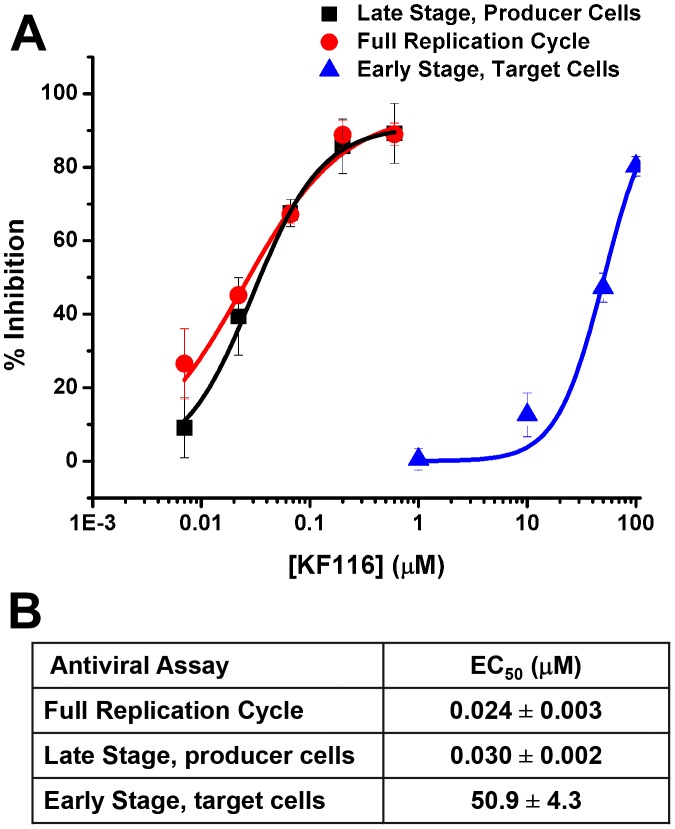
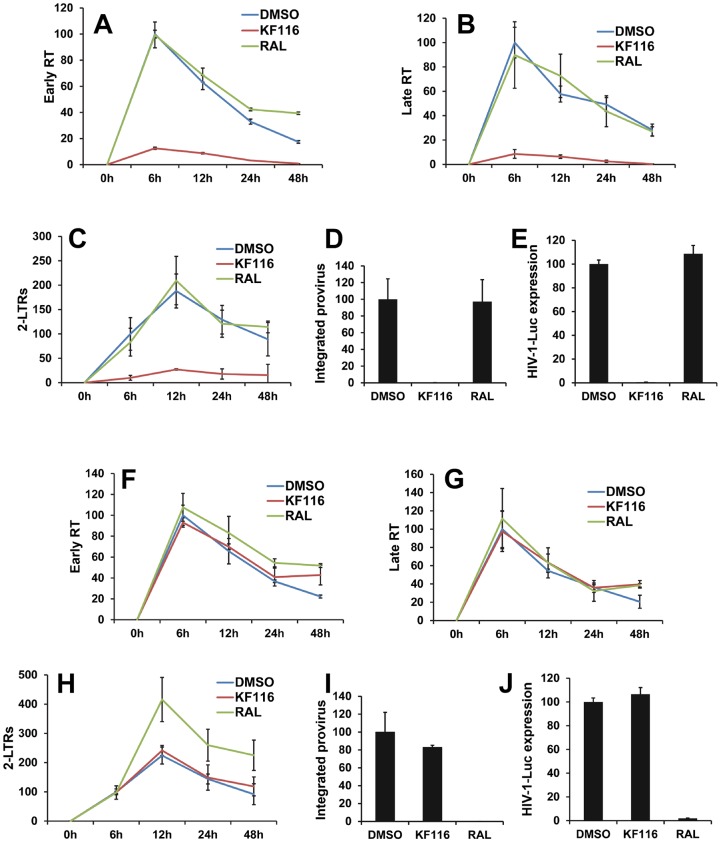
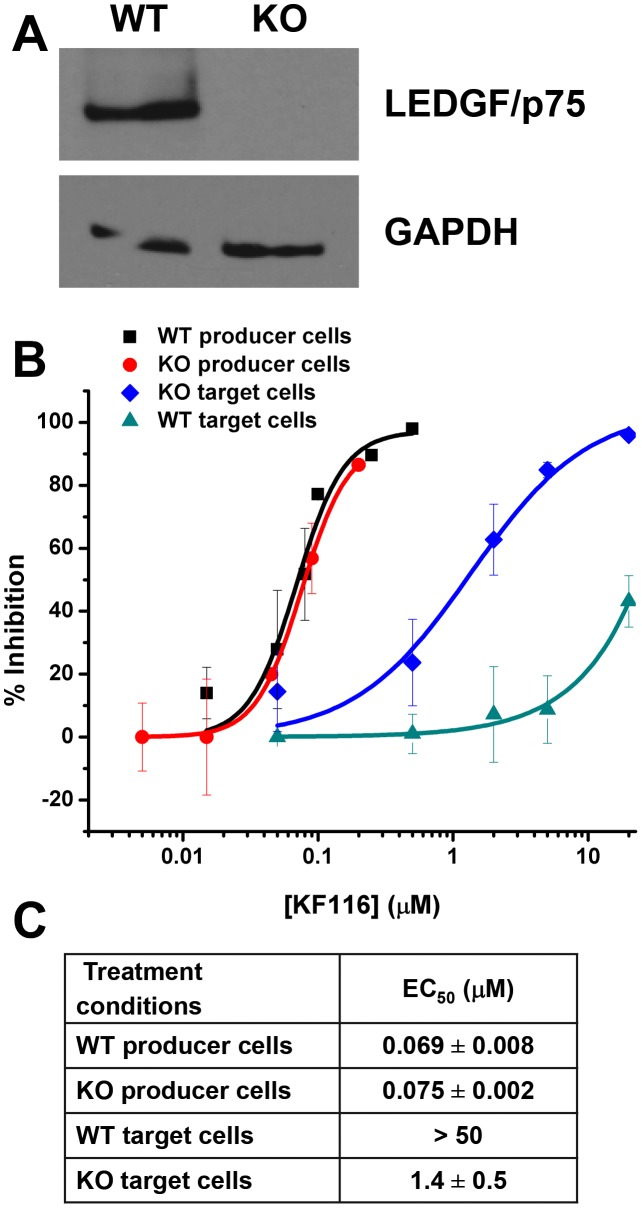
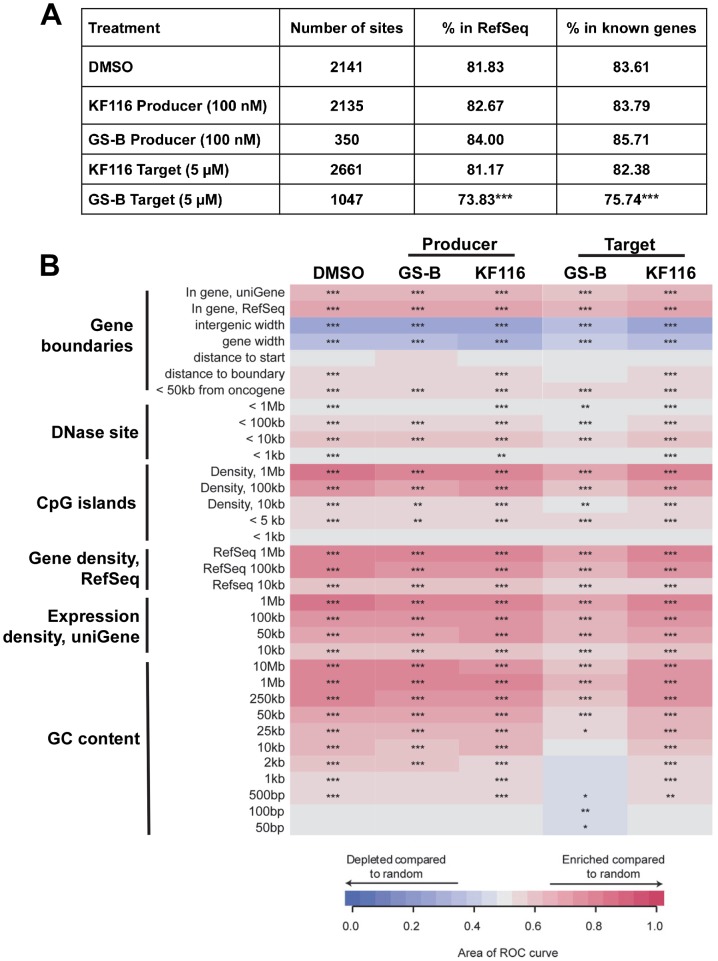
The quinoline-based allosteric HIV-1 integrase (IN) inhibitors (ALLINIs) are promising candidates for clinically useful antiviral agents. Studies using these compounds have highlighted the role of IN in both early and late stages of virus replication. However, dissecting the exact mechanism of action of the quinoline-based ALLINIs has been complicated by the multifunctional nature of these inhibitors because they both inhibit IN binding with its cofactor LEDGF/p75 and promote aberrant IN multimerization with similar potencies in vitro. Here we report design of small molecules that allowed us to probe the role of HIV-1 IN multimerization independently from IN-LEDGF/p75 interactions in infected cells. We altered the rigid quinoline moiety in ALLINIs and designed pyridine-based molecules with a rotatable single bond to allow these compounds to bridge between interacting IN subunits optimally and promote oligomerization. The most potent pyridine-based inhibitor, KF116, potently (EC50 of 0.024 µM) blocked HIV-1 replication by inducing aberrant IN multimerization in virus particles, whereas it was not effective when added to target cells. Furthermore, KF116 inhibited the HIV-1 IN variant with the A128T substitution, which confers resistance to the majority of quinoline-based ALLINIs. A genome-wide HIV-1 integration site analysis demonstrated that addition of KF116 to target or producer cells did not affect LEDGF/p75-dependent HIV-1 integration in host chromosomes, indicating that this compound is not detectably inhibiting IN-LEDGF/p75 binding. These findings delineate the significance of correctly ordered IN structure for HIV-1 particle morphogenesis and demonstrate feasibility of exploiting IN multimerization as a therapeutic target. Furthermore, pyridine-based compounds present a novel class of multimerization selective IN inhibitors as investigational probes for HIV-1 molecular biology.


Conflict of interest statement

The authors declare no competing financial interests. GSB was a gift from Gilead Biosciences. There are no other connections (patents, consultation, products in development etc). This does not alter our adherence to all PLoS Pathogens policies on sharing data and materials.

Figures

Figure 1
Figure 1. Chemical structures of ALLINIs and MINIs.
Figure 2
Figure 2. Crystal structures of LEDGF/IBD (A), BI-1001 (B), KF115 (C), and KF116 (D) bound to HIV-1 IN CCD.
The IN subunit 1 and 2 are colored in cyan and green, respectively. LEDGF/IBD loop (amino acids 365–368) is shown in dark blue. BI-1001 is shown in orange. KF115 is shown in red. KF116 is shown in magenta. The hydrogen bonds between the IN subunit and the LEDGF/IBD or the indicated inhibitors are shown by black dashed lines. Side chains of HIV-1 IN residues A128T and T125 in subunit 1, and E170, H171 and T174 in subunit 2 are shown.
Figure 3
Figure 3. Genotype of HIV-1 variants selected in cell culture in the presence of KF116.
(A) Mutations in the HIV-1NL4-3 IN gene of resistant viruses selected with KF116. Clonal sequencing of viral passage was carried out at passages 5 and 10, respectively. Eighty-two clones from each viral passage were sequenced using three sequencing primers covering the entire IN gene. Percentage of IN mutations for a given passage are indicated. Passage 5 corresponds to 50 days of selection with the KF116 concentration reaching 0.8 µM. Passage 10 corresponds to 100 days of selection with the KF116 concentration reaching 25.6 µM. (B) Crystal structure of KF116 bound to HIV-1 IN CCD dimer indicating the Thr-124, Val-165 and Thr-174 residues. The IN subunit 1 and 2 are colored in cyan and green, respectively. KF116 is shown in magenta.
Figure 4
Figure 4. KF116 selectively impairs the late stage of HIV-1 replication.
(A) Dose-response curves for KF116 antiviral activities during early stage, late stage or one full replication cycle. For early stage experiments, KF116 was added directly to the target cells and then these cells were infected with untreated virions. For late stage experiments, the progeny virions were prepared in the presence of KF116 and were then used to infect untreated target cells. For one full replication cycle experiments, KF116 was added to both producer and target cells. (B) EC50 values for the indicated antiviral assays. Results represent mean ± SD from three independent experiments.
Figure 5
Figure 5. KF116 impairs formation of dense cores in HIV-1 virions.
(A) Representative thin-section electron micrographs of HIV-1 virions produced in the presence of DMSO or 1 µM KF116. (B) Quantitative analysis of mature virions prepared in the presence of DMSO or 1 µM KF116. Correctly matured electron dense cores are shown in black and eccentric virions lacking electron density are shown in gray. Standard errors determined from two independent experiments are shown. Images of at least 50 mature virions were examined from each experiment. (C) Sucrose density gradient fractionation of detergent-lysed HIV-1 virions produced in HEK293T cells in the presence of DMSO or 1 µM KF116. Cell-free virions were harvested, detergent-lysed, and separated on 30–70% linear sucrose density gradients. Twenty-one 0.5 ml fractions were collected from the top of the gradient and subjected to SDS-PAGE and immunoblotted with HIV-1 Gag antisera to monitor the distribution of HIV-1 capsid. Positions of Gag p24 (capsid) and Gag p17 (matrix) are indicated. (D) Quantitation of HIV-1 capsid (p24) signal intensity from (B) as measured by ImageJ software. Graph represents the relative distribution of HIV-1 capsid (p24) in each of the sucrose density gradient fractions.
Figure 6
Figure 6. Virions produced in the presence of KF116 are defective in reverse transcription.
(A–E) VSV-G pseudotyped HIV-1-Luc produced in the presence of DMSO, 1 µM KF116, or 1 µM RAL were used to infect HEK293T cells. Infected cells were harvested at the indicated times and subjected to quantitative PCR (qPCR) or luciferase assay. Graphs indicate the amount of PCR products relative to non-treated (DMSO) sample at 6 h post-infection for (A) early reverse transcription (Early RT), (B) late reverse transcription (Late RT) and (C) 2-LTR circles (2-LTRs) products. (D) Bar graphs indicate the integrated provirus relative to non-treated (DMSO) control at 7 days post-infection. (E) Aliquots of infected cells were harvested and luciferase assay was performed at 48 h post-infection. The luciferase signal obtained for the non-treated (DMSO) sample was set to 100%. All graphs represent mean ± SD (n = 3). (F–J) HEK293T cells were treated with DMSO, 1 µM KF116, or 1 µM RAL and then infected with VSV-G pseudotyped HIV-1-Luc. Infected cells were harvested at the indicated times and subjected to qPCR or luciferase assay. Graphs indicate the amount of PCR products relative to non-treated (DMSO) sample at 6 h post-infection for (F) early reverse transcription (Early RT), (G) late reverse transcription (Late RT) and (H) 2-LTR circles (2-LTRs) products. (I) Bar graphs indicate the integrated provirus relative to non-treated (DMSO) sample at 7 days post-infection. (J) Aliquots of infected cells were harvested and luciferase assay was performed at 48 h post-infection. The luciferase signal obtained for the non-treated (DMSO) sample was set to 100%. All graphs represent mean ± SD (n = 3).
Figure 7
Figure 7. KF116 promotes IN multimerization in vitro and in HIV-1 particles.
(A) DLS analysis of KF116-induced multimerization of recombinant IN. Size distribution of IN at 2 minutes (blue), 8 minutes (red), 30 minutes (green) and 120 minutes (yellow) after addition of KF116. No detectable signal was recorded in control experiments with KF116 alone or IN+DMSO incubated for up to 120 minutes. (B) The schematic to show the inhibitor induced equilibrium shift toward aberrant IN oligomerization. (C) HIV-1 virions were produced in HEK293T cells in the presence of DMSO or 1 µM KF116, cell-free virions were harvested, detergent-lysed, and treated with BS3 cross-linking reagent. The indicated volumes of cross-linked reaction products were resolved by SDS-PAGE and immunoblotted with HIV-1 IN antibody. The bands corresponding to IN “monomer”, “dimer”, and “higher order oligomers” are indicated.
Figure 8
Figure 8. LEDGF/p75 expression does not affect KF116 potency during late stage of HIV-1 replication.
(A) Equivalent whole cell lysates from the clonal TALEN-derived PSIP1 KO cell line (indicated as “KO”) and parental wild type HEK293T cell line (indicated as “WT”) were subjected to SDS-PAGE and immunoblotted for LEDGF/p75 and a GAPDH control to verify knockdown of LEDGF/p75 protein. (B) Dose-response curves representing the antiviral assays performed in WT or KO cell lines under the indicated conditions of drug treatment. For producer cell treatment, the VSV-G pseudotyped HIV-1-Luc progeny virions were prepared in the indicated cell line in the presence of KF116 and were then used to infect untreated HEK293T cells. For target cell treatment, KF116 was added directly to the indicated cell line and the cells were infected with untreated VSV-G pseudotyped HIV-1-Luc virions. (C) EC50 values for the indicated antiviral assays. Results represent mean ± SD from three independent experiments.
Figure 9
Figure 9. Effects of MINI KF116 and ALLINI GS-B on LEDGF/p75-dependent targeting of HIV-1 integration site distribution on chromatin.
(A) HIV-1 integration frequencies in RefSeq and known genes, comparing effects of KF116 and GS-B on LEDGF/p75-dependent targeting of HIV-1 integration. All the samples differed significantly from their respective matched random controls (using Fisher's exact test, P<0.001). Significant deviation from the control non-treated (DMSO) sample was calculated using Fisher's exact test and is denoted by asterisks (*** P<0.001). (B) Heatmap summarizing HIV-1 integration frequencies relative to the genomic features. The columns depict HIV-1 integration site data sets for the indicated drug treatments. For experiments involving the drug treatment of virus-producer cells (indicated “Producer”), the progeny virions were prepared in the presence of 0.1 µM KF116 or 0.1 µM GS-B and were then used to infect untreated target cells. For experiments involving the drug treatment of target cells (indicated “Target”), 5 µM KF116 or 5 µM GS-B inhibitor was added directly to the target cells and the cells were infected with untreated virions. The rows depict the analyzed genomic features and the base pair values shown in the rows indicate the size of a given genomic interval used for the analysis. The relationship between HIV-1 integration site frequencies relative to matched random controls for each of the genomic feature was quantified using the receiver operator characteristic (ROC) curve area method. The color key shows enrichment (indicated in red) or depletion (indicated in blue) of a given genomic feature near integration sites. P values were calculated for the individual integration site data sets compared to the matched random controls, ***P<0.001; **P<0.01; *P<0.05.

References

    1. Brown PO (1997) Integration. In: Coffin JM, Hughes SH, Varmus HE, editors. Retroviruses. Plainview, NY: Cold Spring Harbor Laboratory. pp. 161–204.
    1. Li X, Krishnan L, Cherepanov P, Engelman A (2011) Structural biology of retroviral DNA integration. Virology 411: 194–205. - PMC - PubMed
    1. Andrake MD, Skalka AM (1995) Multimerization determinants reside in both the catalytic core and C terminus of avian sarcoma virus integrase. J Biol Chem 270: 29299–29306. - PubMed
    1. Jenkins TM, Engelman A, Ghirlando R, Craigie R (1996) A soluble active mutant of HIV-1 integrase: involvement of both the core and carboxyl-terminal domains in multimerization. J Biol Chem 271: 7712–7718. - PubMed
    1. Chen JC, Krucinski J, Miercke LJ, Finer-Moore JS, Tang AH, et al. (2000) Crystal structure of the HIV-1 integrase catalytic core and C-terminal domains: a model for viral DNA binding. Proc Natl Acad Sci U S A 97: 8233–8238. - PMC - PubMed

MeSH terms

Substances