

Photon counting spectral CT component analysis of coronary artery atherosclerotic plaque samples
- PMID: 24874766
- PMCID: PMC4112393
- DOI: 10.1259/bjr.20130798
Photon counting spectral CT component analysis of coronary artery atherosclerotic plaque samples
Abstract
Objective: To evaluate the capabilities of photon counting spectral CT to differentiate components of coronary atherosclerotic plaque based on differences in spectral attenuation and iodine-based contrast agent concentration.
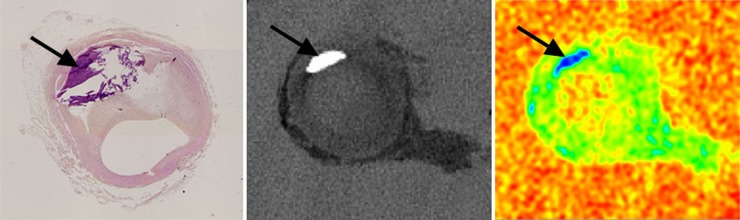
Methods: 10 calcified and 13 lipid-rich non-calcified histologically demonstrated atheromatous plaques from post-mortem human coronary arteries were scanned with a photon counting spectral CT scanner. Individual photons were counted and classified in one of six energy bins from 25 to 70 keV. Based on a maximum likelihood approach, maps of photoelectric absorption (PA), Compton scattering (CS) and iodine concentration (IC) were reconstructed. Intensity measurements were performed on each map in the vessel wall, the surrounding perivascular fat and the lipid-rich and the calcified plaques. PA and CS values are expressed relative to pure water values. A comparison between these different elements was performed using Kruskal-Wallis tests with pairwise post hoc Mann-Whitney U-tests and Sidak p-value adjustments.
Results: RESULTS for vessel wall, surrounding perivascular fat and lipid-rich and calcified plaques were, respectively, 1.19 ± 0.09, 0.73 ± 0.05, 1.08 ± 0.14 and 17.79 ± 6.70 for PA; 0.96 ± 0.02, 0.83 ± 0.02, 0.91 ± 0.03 and 2.53 ± 0.63 for CS; and 83.3 ± 10.1, 37.6 ± 8.1, 55.2 ± 14.0 and 4.9 ± 20.0 mmol l(-1) for IC, with a significant difference between all tissues for PA, CS and IC (p < 0.012).
Conclusion: This study demonstrates the capability of energy-sensitive photon counting spectral CT to differentiate between calcifications and iodine-infused regions of human coronary artery atherosclerotic plaque samples by analysing differences in spectral attenuation and iodine-based contrast agent concentration.
Advances in knowledge: Photon counting spectral CT is a promising technique to identify plaque components by analysing differences in iodine-based contrast agent concentration, photoelectric attenuation and Compton scattering.
Figures


References
-
- Libby P. Current concepts of the pathogenesis of the acute coronary syndromes. Circulation 2001; 104: 365–72. - PubMed
-
- Virmani R, Kolodgie FD, Burke AP, Farb A, Schwartz SM. Lessons from sudden coronary death: a comprehensive morphological classification scheme for atherosclerotic lesions. Arterioscler Thromb Vasc Biol 2000; 20: 1262–75. - PubMed
-
- Budoff MJ, Achenbach S, Blumenthal RS, Carr JJ, Goldin JG, Greenland P, et al. Assessment of coronary artery disease by cardiac computed tomography: a scientific statement from the American Heart Association Committee on Cardiovascular Imaging and Intervention, Council on Cardiovascular Radiology and Intervention, and Committee on Cardiac Imaging, Council on Clinical Cardiology. Circulation 2006; 114: 1761–91. - PubMed
-
- Chopard R, Boussel L, Motreff P, Rioufol G, Tabib A, Douek P, et al. How reliable are 40 MHz IVUS and 64-slice MDCT in characterizing coronary plaque composition? An ex vivo study with histopathological comparison. Int J Cardiovasc Imaging 2010; 26: 373–83. doi: 10.1007/s10554-009-9562-y - DOI - PubMed
-
- Van der Giessen AG, Toepker MH, Donelly PM, Bamberg F, Schlett CL, Raffle C, et al. Reproducibility, accuracy, and predictors of accuracy for the detection of coronary atherosclerotic plaque composition by computed tomography: an ex vivo comparison to intravascular ultrasound. Invest Radiol 2010; 45: 693–701. - PubMed
MeSH terms
Substances
LinkOut - more resources
Full Text Sources
Other Literature Sources
Medical
