

The macroecology of airborne pollen in Australian and New Zealand urban areas
- PMID: 24874807
- PMCID: PMC4038531
- DOI: 10.1371/journal.pone.0097925
The macroecology of airborne pollen in Australian and New Zealand urban areas
Abstract
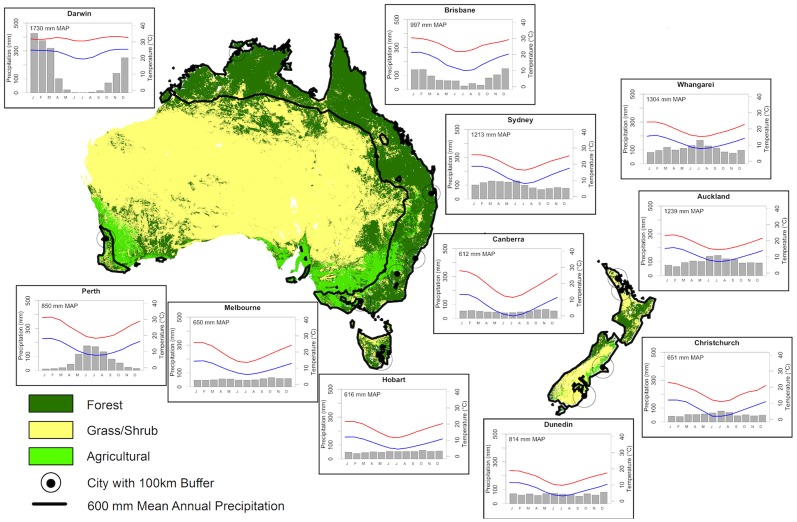
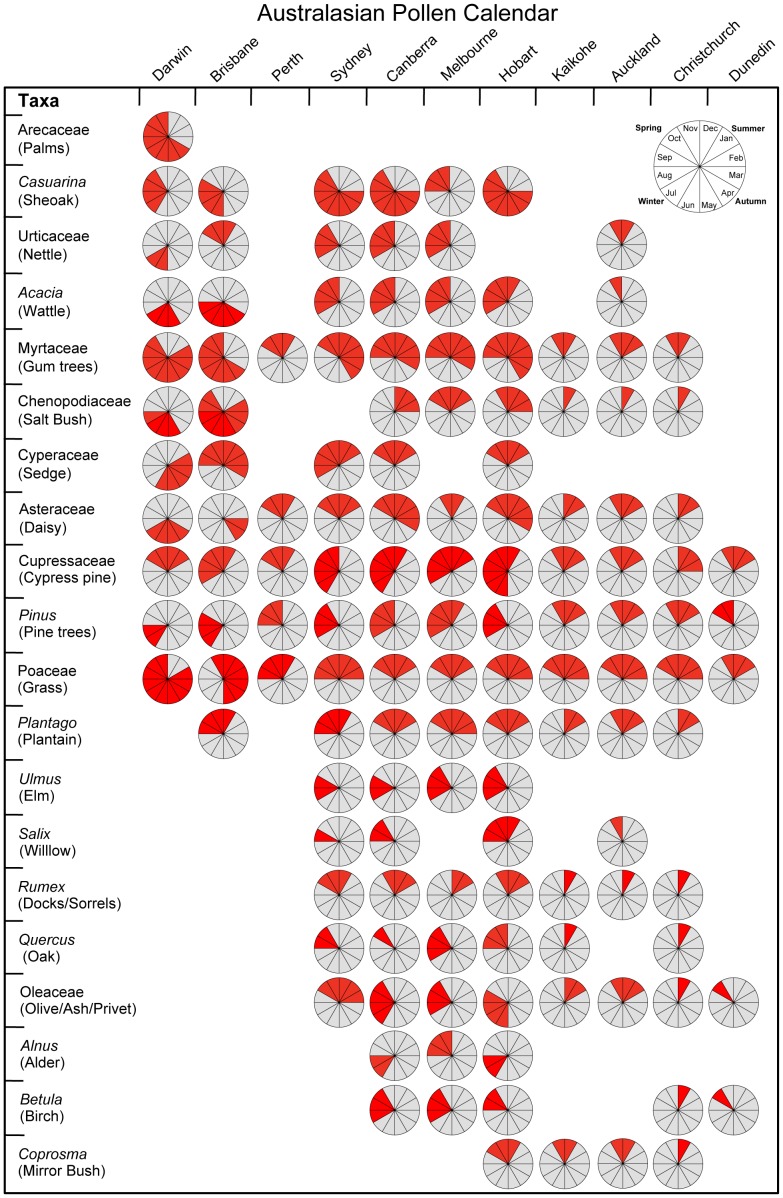
The composition and relative abundance of airborne pollen in urban areas of Australia and New Zealand are strongly influenced by geographical location, climate and land use. There is mounting evidence that the diversity and quality of airborne pollen is substantially modified by climate change and land-use yet there are insufficient data to project the future nature of these changes. Our study highlights the need for long-term aerobiological monitoring in Australian and New Zealand urban areas in a systematic, standardised, and sustained way, and provides a framework for targeting the most clinically significant taxa in terms of abundance, allergenic effects and public health burden.
Conflict of interest statement
Figures
Similar articles
-
Impact of land cover changes and climate on the main airborne pollen types in Southern Spain.Sci Total Environ. 2016 Apr 1;548-549:221-228. doi: 10.1016/j.scitotenv.2016.01.005. Epub 2016 Jan 21. Sci Total Environ. 2016. PMID: 26802350
-
Climate sensitivity of allergenic taxa in Central Europe associated with new climate change related forces.Sci Total Environ. 2013 Jan 1;442:36-47. doi: 10.1016/j.scitotenv.2012.10.067. Epub 2012 Nov 21. Sci Total Environ. 2013. PMID: 23178762
-
Allergenic pollen and pollen allergy in Europe.Allergy. 2007 Sep;62(9):976-90. doi: 10.1111/j.1398-9995.2007.01393.x. Epub 2007 May 22. Allergy. 2007. PMID: 17521313 Review.
-
Allergenic pollen season variations in the past two decades under changing climate in the United States.Glob Chang Biol. 2015 Apr;21(4):1581-9. doi: 10.1111/gcb.12755. Epub 2014 Nov 7. Glob Chang Biol. 2015. PMID: 25266307 Free PMC article.
-
[Perspectives on synergic biological effects induced by ambient allergenic pollen and urban fine/ultrafine particulate matters in atmosphere].Huan Jing Ke Xue. 2010 Sep;31(9):2260-6. Huan Jing Ke Xue. 2010. PMID: 21072956 Review. Chinese.
Cited by
-
The South African Pollen Monitoring Network: Insights from 2 years of national aerospora sampling (2019-2021).Clin Transl Allergy. 2023 Nov;13(11):e12304. doi: 10.1002/clt2.12304. Clin Transl Allergy. 2023. PMID: 38006379 Free PMC article.
-
Relationship between airborne pollen assemblages and major meteorological parameters in Zhanjiang, South China.PLoS One. 2020 Oct 7;15(10):e0240160. doi: 10.1371/journal.pone.0240160. eCollection 2020. PLoS One. 2020. PMID: 33027306 Free PMC article.
-
Aerobiological Dynamics and Climatic Sensitivity of Airborne Pollen in Southeastern Türkiye: A Two-Year Assessment from Siirt.Biology (Basel). 2025 Jul 10;14(7):841. doi: 10.3390/biology14070841. Biology (Basel). 2025. PMID: 40723399 Free PMC article.
-
A story of data won, data lost and data re-found: the realities of ecological data preservation.Biodivers Data J. 2018 Nov 7;(6):e28073. doi: 10.3897/BDJ.6.e28073. eCollection 2018. Biodivers Data J. 2018. PMID: 30473618 Free PMC article.
-
Regional and seasonal variation in airborne grass pollen levels between cities of Australia and New Zealand.Aerobiologia (Bologna). 2016 Jun;32(2):289-302. doi: 10.1007/s10453-015-9399-x. Epub 2015 Jul 29. Aerobiologia (Bologna). 2016. PMID: 27069303 Free PMC article.
References
-
- D'Costa D, Kershaw AP (1997) An expanded recent pollen database from south-eastern Australia and its potential for refinement of palaeoclimatic estimates. Aust J Bot 45: 583–605.
-
- Wilmshurst JM, McGlone MS (2005) Origin of pollen and spores in surface lake sediments: comparison of modern palynomorph assemblages in moss cushions, surface soils and surface lake sediments. Rev Palaeobot Palynol 136: 1–15.
-
- Fletcher M-S, Thomas I (2007) Modern pollen–vegetation relationships in western Tasmania, Australia. Rev Palaeobot Palynol 146: 146–168.
-
- Tng DYP, Hopf F, Haberle SG, Bowman DMJS (2010) Seasonal pollen distribution in the atmosphere of Hobart, Tasmania: preliminary observations and congruence with flowering phenology. Aust J Bot 58: 440–452.
-
- Schäppi GF, Taylor PE, Kenrick J, Staff IA, Suphioglu C (1998) Predicting the grass pollen count from meteorological data with regard to estimating the severity of hayfever symptoms in Melbourne (Australia). Aerobiologia 14: 29–37.
Publication types
MeSH terms
Substances
LinkOut - more resources
Full Text Sources
Other Literature Sources
