

Structural order in ultrathin films of the monolayer protected clusters based upon 4 nm gold nanocrystals: an experimental and theoretical study
- PMID: 24875295
- PMCID: PMC4128557
- DOI: 10.1039/c4cp01612b
Structural order in ultrathin films of the monolayer protected clusters based upon 4 nm gold nanocrystals: an experimental and theoretical study
Abstract
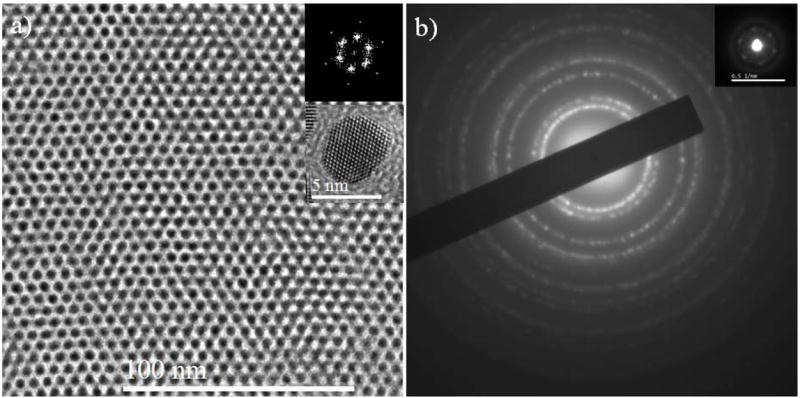
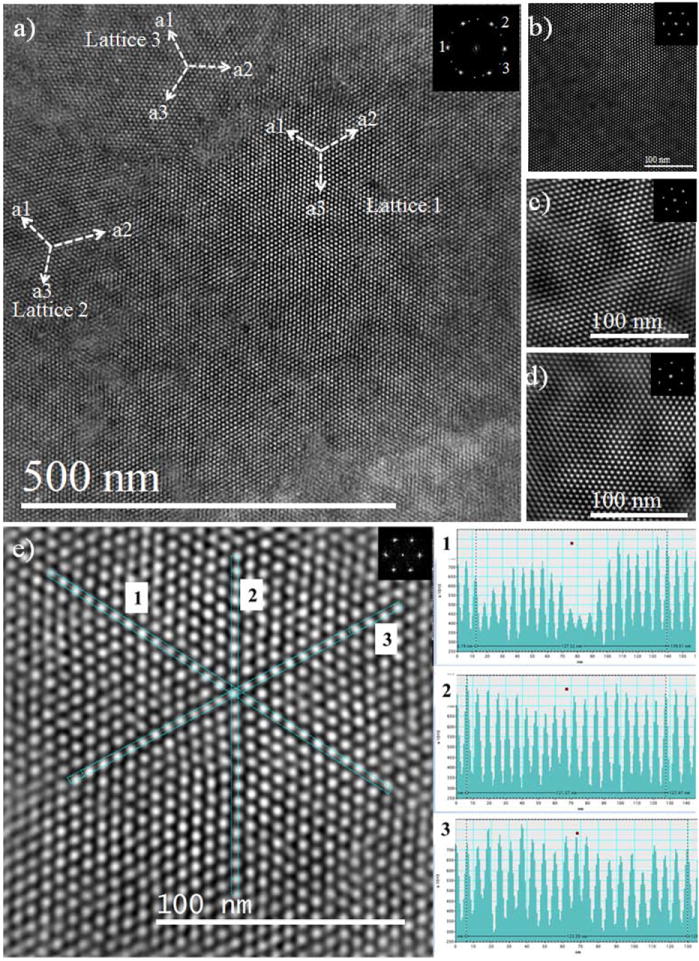
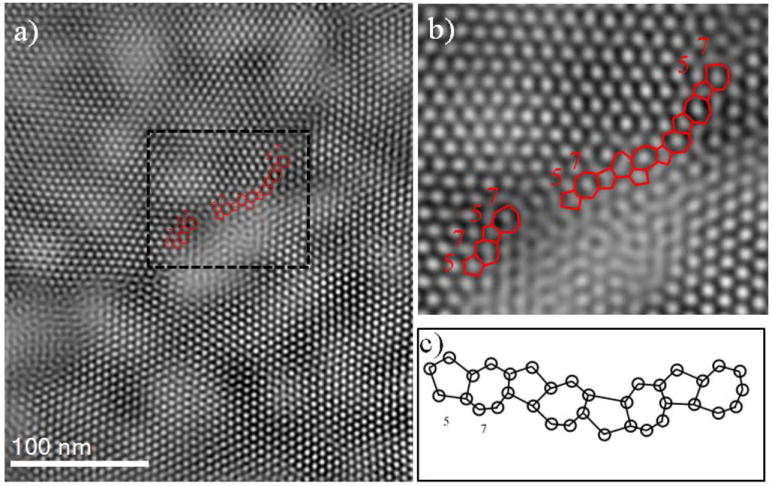
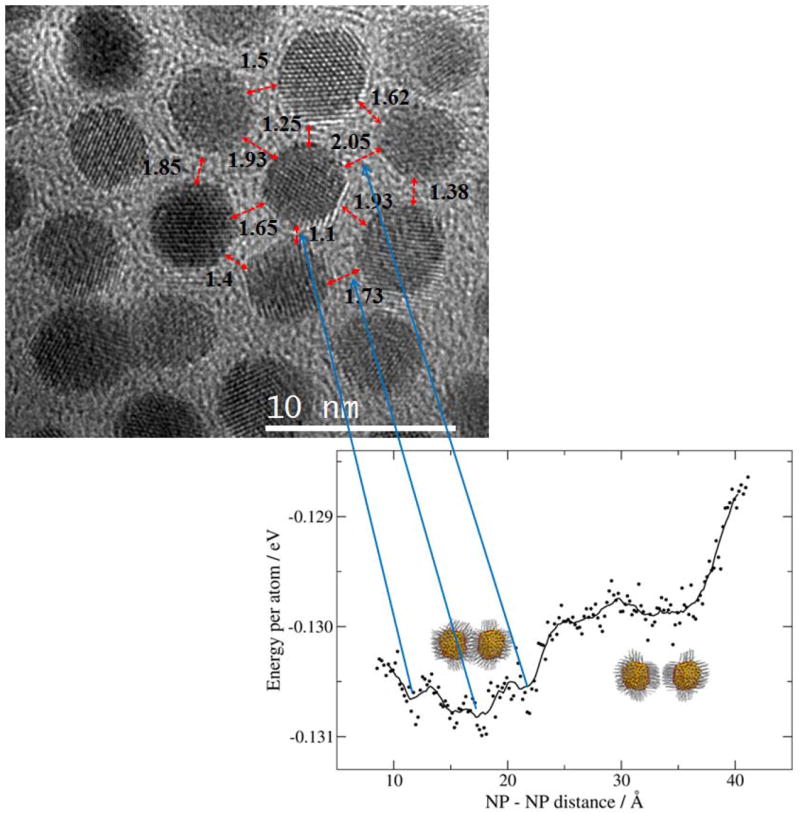
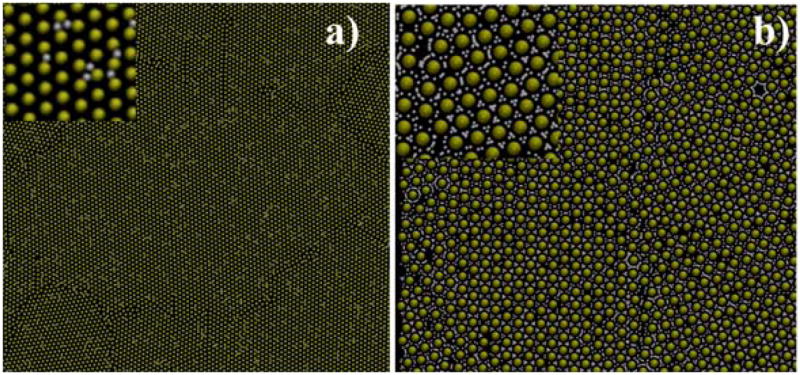
The structural order in ultrathin films of monolayer protected clusters (MPCs) is important in a number of application areas but can be difficult to demonstrate by conventional methods, particularly when the metallic core dimension, d, is in the intermediate size-range, 1.5 < d < 5.0 nm. Here, improved techniques for the synthesis of monodisperse thiolate-protected gold nanoparticles have made possible the production of dodecane-thiolate saturated ∼4 ± 0.5 nm Au clusters with single-crystal core structure and morphology. An ultrathin ordered film or superlattice of these nanocrystal-core MPCs is prepared and investigated using aberration corrected scanning/transmission electron microscopy (STEM) which allowed imaging of long-range hexagonally ordered superlattices of the nanocrystals, separated by the thiolate groups. The lattice constants determined by direct imaging are in good agreement with those determined by small-angle electron diffraction. The STEM image revealed the characteristic grain boundary (GB) with sigma (Σ) 13 in the interface between two crystals. The formation and structures found are interpreted on the basis of theoretical calculations employing molecular dynamics (MD) simulations and coarse-grained (CG) approach.
Figures
Similar articles
-
Growth regimes of porous gold thin films deposited by magnetron sputtering at oblique incidence: from compact to columnar microstructures.Nanotechnology. 2013 Feb 1;24(4):045604. doi: 10.1088/0957-4484/24/4/045604. Epub 2013 Jan 8. Nanotechnology. 2013. PMID: 23299349
-
Self-assembled pit arrays as templates for the integration of Au nanocrystals in oxide surfaces.Nanoscale. 2013 Feb 7;5(3):1001-8. doi: 10.1039/c2nr33181k. Epub 2012 Dec 18. Nanoscale. 2013. PMID: 23250118
-
Shaping gold nanocomposites with tunable optical properties.Langmuir. 2010 Jul 6;26(13):11407-12. doi: 10.1021/la100875j. Langmuir. 2010. PMID: 20415508
-
On the fluctuation mechanism of melting of supported gold nanoclusters.J Nanosci Nanotechnol. 2012 Nov;12(11):8676-80. doi: 10.1166/jnn.2012.6823. J Nanosci Nanotechnol. 2012. PMID: 23421264
-
Characterization of thiolate-protected gold nanoparticles by mass spectrometry.Analyst. 2010 May;135(5):868-74. doi: 10.1039/b922291j. Epub 2010 Feb 9. Analyst. 2010. PMID: 20419232 Free PMC article. Review.
Cited by
-
Origin of large plasticity and multiscale effects in iron-based metallic glasses.Nat Commun. 2018 Apr 6;9(1):1333. doi: 10.1038/s41467-018-03744-5. Nat Commun. 2018. PMID: 29626189 Free PMC article.
-
Highly monodisperse multiple twinned AuCu-Pt trimetallic nanoparticles with high index surfaces.Phys Chem Chem Phys. 2014 Aug 14;16(30):16278-83. doi: 10.1039/c4cp02208d. Phys Chem Chem Phys. 2014. PMID: 24975090 Free PMC article.
References
-
- Billinge SJ, Levin I. Science. 2007;316:561–565. - PubMed
-
- Mueggenburg KE, Lin X-M, Goldsmith RH, Jaeger HM. Nat Mater. 2007;6:656–660. - PubMed
-
- Bigioni TP, Lin X-M, Nguyen TT, Corwin EI, Witten TA, Jaeger HM. Nat Mater. 2006;5:265–270. - PubMed
-
- Gutierrez-Wing C, Ascencio J, Perez-Alvarez M, Marin-Almazo M, Jose-Yacaman M. J Clust Sci. 1998;9:529–545.
Publication types
MeSH terms
Substances
Grants and funding
LinkOut - more resources
Full Text Sources
Other Literature Sources