. 2014 May 29;10(5):e1004367.
doi: 10.1371/journal.pgen.1004367. eCollection 2014.

A genome-wide assessment of the role of untagged copy number variants in type 1 diabetes

Affiliations

A genome-wide assessment of the role of untagged copy number variants in type 1 diabetes

Manuela Zanda et al. PLoS Genet. .

Abstract

Genome-wide association studies (GWAS) for type 1 diabetes (T1D) have successfully identified more than 40 independent T1D associated tagging single nucleotide polymorphisms (SNPs). However, owing to technical limitations of copy number variants (CNVs) genotyping assays, the assessment of the role of CNVs has been limited to the subset of these in high linkage disequilibrium with tag SNPs. The contribution of untagged CNVs, often multi-allelic and difficult to genotype using existing assays, to the heritability of T1D remains an open question. To investigate this issue, we designed a custom comparative genetic hybridization array (aCGH) specifically designed to assay untagged CNV loci identified from a variety of sources. To overcome the technical limitations of the case control design for this class of CNVs, we genotyped the Type 1 Diabetes Genetics Consortium (T1DGC) family resource (representing 3,903 transmissions from parents to affected offspring) and used an association testing strategy that does not necessitate obtaining discrete genotypes. Our design targeted 4,309 CNVs, of which 3,410 passed stringent quality control filters. As a positive control, the scan confirmed the known T1D association at the INS locus by direct typing of the 5' variable number of tandem repeat (VNTR) locus. Our results clarify the fact that the disease association is indistinguishable from the two main polymorphic allele classes of the INS VNTR, class I-and class III. We also identified novel technical artifacts resulting into spurious associations at the somatically rearranging loci, T cell receptor, TCRA/TCRD and TCRB, and Immunoglobulin heavy chain, IGH, loci on chromosomes 14q11.2, 7q34 and 14q32.33, respectively. However, our data did not identify novel T1D loci. Our results do not support a major role of untagged CNVs in T1D heritability.


Conflict of interest statement

The authors have declared that no competing interests exist.

Figures

Figure 1
Figure 1. Summary of the CNVs included in the array design and tested for T1D association using FBAT-CNV.
CNVs originate from two main sources: the GSV map of common CNVs and the 1,000 Genomes sequence data. Tested CNVs also include 365 novel insertion CNVs obtained from the Venter genome. Detailed description of the array design is provided in Text S1.
Figure 2
Figure 2. Differences between case-control and FBAT-CNV association tests.
A- In a case-control analysis, technical variability may affect the CNV intensity data between cases and controls. Therefore, it is necessary to call the discrete genotypes, potentially allowing for genotype uncertainty in the association tests. Mixture models are typically used for calling, as illustrated by the colored lines on top of the histograms. Intensity data must therefore be sufficiently separated to make these discrete calls (CNV data in this example obtained from both control groups in the WTCCC study [28]). B- With the FBAT-CNV framework, one compares the average parental CNV signal with the signal for affected offspring. Consistent deviation of affected offspring intensity data compared to parental average indicates biased transmission of CNV alleles. As the test is solely based on the intensity data, and no systematic bias is expected between parents and offspring, it is not necessary to make discrete calls (CNV data obtained from INS VNTR first principal component).
Figure 3
Figure 3. Spurious associations at TCR and IGH loci.
Age at sampling (x-axis) versus CNV intensity signal (y-axis) for the three most associated Immunoglobin Heavy (IGH) and T cell receptor (TCR) loci CNVs. Each point represents an individual in the study (irrespective of familial/T1D status). Blue crosses indicate DNA extracted from LCLs (N = 551) and red crosses DNA extracted from blood (N = 2,981). Red and blue lines have been fitted to the LCL/blood data using cubic splines. A - CNVR6085.1 (chr14:21977832-21987926) mapping to TCR alpha and TCR delta locus on chr14, FBAT-CNV P = 3.6 10−63. The plot shows correlation between age at sampling and probe intensity for DNA extracted from blood samples. B - CNVR3590.1 (chr7:142194021-142204412) mapping to TCR beta locus on chr7, FBAT-CNV P = 4.4 10−31. The plot shows correlation between age at sampling and probe intensity for DNA extracted from blood samples. C - CNVR6294.22 (chr14:105433837-105441555) mapping to Ig heavy chain locus on chr14, FBAT-CNV P = 6.5 10−5. No age-dependent effect was detected at this locus.
Figure 4
Figure 4. Quantile-quantile plot comparing the expected versus the observed distribution of the FBAT-CNV P-values.
These plots show the distribution of -2log10(p), which is, under the null, distributed as chi-square with 2 degrees-of-freedom. IgG/TCR loci are discussed elsewhere and not included in these plots. A – N = 3,286 CNVs that passed quality controls and were tested for association. Loci overlapping the MHC region are marked in blue. Loci mapping to, or in strong LD with, the INS VNTR region are marked in red. B – N = 3,214 CNVs passed quality controls and did not overlap or tagged the INS VNTR and the MHC region. C – N = 448 VNTRs targeted by the CGH array that passed quality controls. INS VNTR CNV regions are marked in red as in Figure 3A.
Figure 5
Figure 5. Manhattan plot for the FBAT-CNV P-values.
The y-axis shows the distribution of –log10(p) where p is the FBAT-CNV test association test P-value for all CNV loci passing quality control filters (Methods). The x-axis shows chromosomes numbered from 1 (left) to X (right).
Figure 6
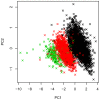
Figure 6. Decomposition of multi-probe CNV data at the INS VNTR locus into first two principal components PC1 and PC2.
Principal components PC1 and PC2 summarize the multi-probe CNV data at the INS VNTR locus. Colors (green/red/black) were chosen based on the genotypes of the SNP rs689 (AA/AT/TT), which captures the class I-class III separation.

References

    1. Rewers M, LaPorte RE, King H, Tuomilehto J (1988) Trends in the prevalence and incidence of diabetes: insulin-dependent diabetes mellitus in childhood. World Health Stat Q 41: : 179–189. Available: http://www.ncbi.nlm.nih.gov/pubmed/2466379. Accessed 11 September 2013. - PubMed
    1. Rewers M (1991) The changing face of the epidemiology of insulin-dependent diabetes mellitus (IDDM): research designs and models of disease causation. Ann Med Ann Med 23: : 419–426 Available: http://www.ncbi.nlm.nih.gov/pubmed/1930939. Accessed 9 August 2013. - PubMed
    1. Bach J-F (2002) The effect of infections on susceptibility to autoimmune and allergic diseases. N Engl J Med 347: : 911–920. Available: http://www.ncbi.nlm.nih.gov/pubmed/12239261. Accessed 6 February 2013. - PubMed
    1. Mohr S, Garland C, Gorham E, Garland F (2008) The association between ultraviolet B irradiance, vitamin D status and incidence rates of type 1 diabetes in 51 regions worldwide. Diabetologia 51: 1391–1398 Available: 10.1007/s00125-008-1061-5. - DOI - PubMed
    1. Barrett JC, Clayton DG, Concannon P, Akolkar B, Cooper JD, et al. (2009) Genome-wide association study and meta-analysis find that over 40 loci affect risk of type 1 diabetes. Nat Genet 41: 703–707 Available: 10.1038/ng.381. - DOI - PMC - PubMed

Publication types

MeSH terms