. 2014 Jul;42(12):8049-61.
doi: 10.1093/nar/gku480. Epub 2014 May 29.

siPools: highly complex but accurately defined siRNA pools eliminate off-target effects

Affiliations

siPools: highly complex but accurately defined siRNA pools eliminate off-target effects

Michael Hannus et al. Nucleic Acids Res. 2014 Jul.

Abstract

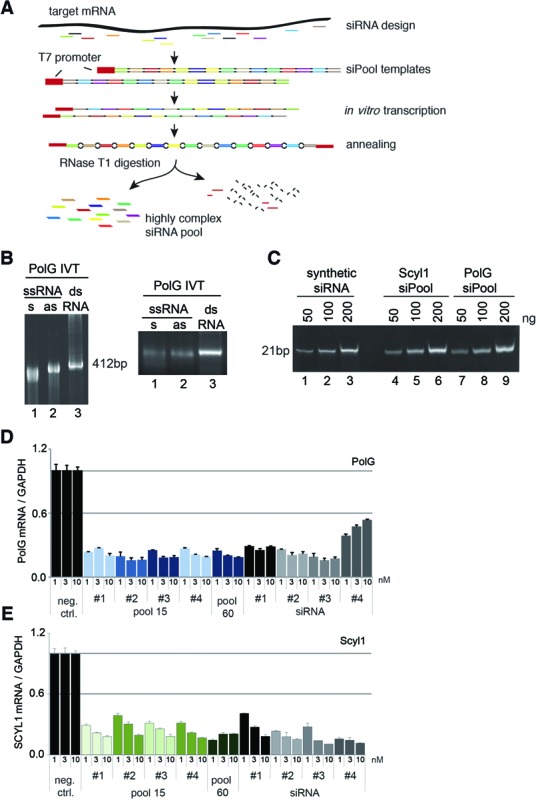
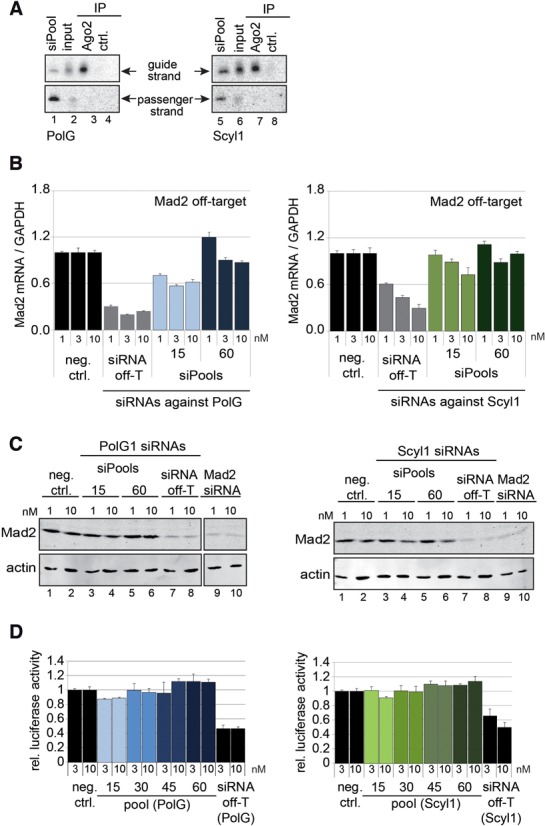
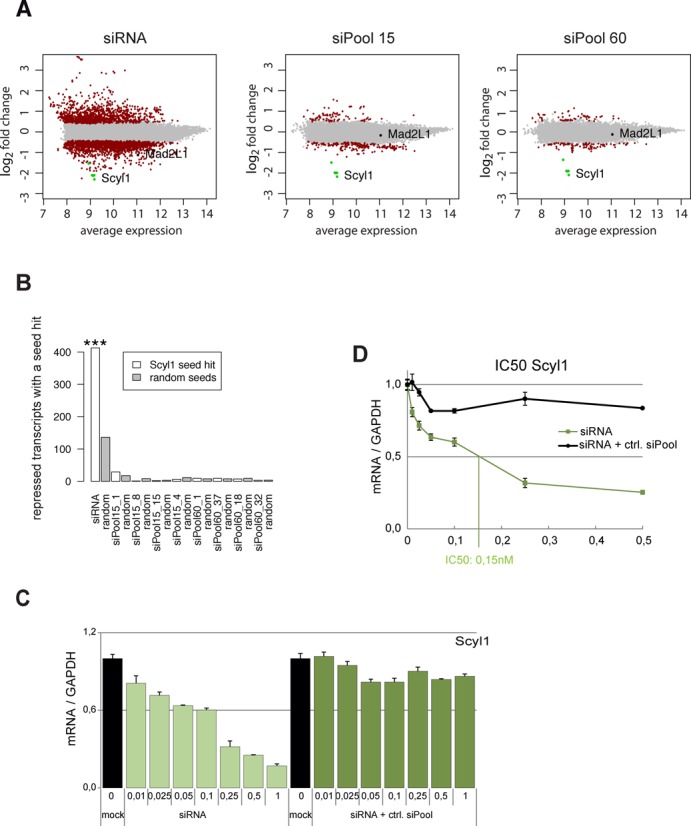
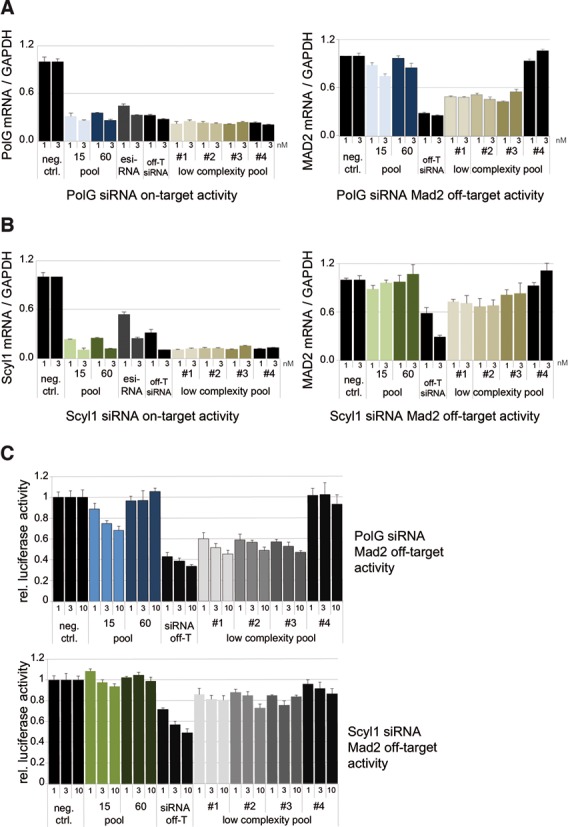
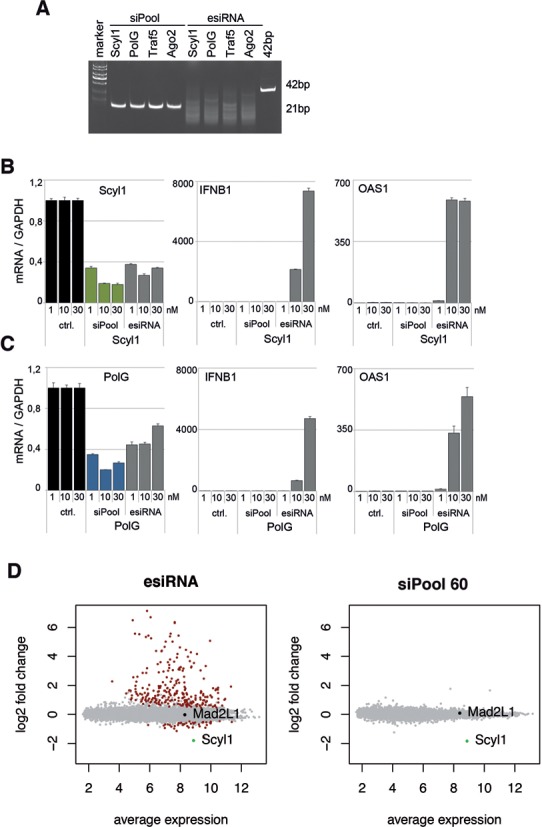
Short interfering RNAs (siRNAs) are widely used as tool for gene inactivation in basic research and therapeutic applications. One of the major shortcomings of siRNA experiments are sequence-specific off-target effects. Such effects are largely unpredictable because siRNAs can affect partially complementary sequences and function like microRNAs (miRNAs), which inhibit gene expression on mRNA stability or translational levels. Here we demonstrate that novel, enzymatically generated siRNA pools-referred to as siPools-containing up to 60 accurately defined siRNAs eliminate off-target effects. This is achieved by the low concentration of each individual siRNA diluting sequence-specific off-target effects below detection limits. In fact, whole transcriptome analyses reveal that single siRNA transfections can severely affect global gene expression. However, when complex siRNA pools are transfected, almost no transcriptome alterations are observed. Taken together, we present enzymatically produced complex but accurately defined siRNA pools with potent on-target silencing but without detectable off-target effects.


Figures

Figure 1.
Figure 1.
siPool generation and on-target activity. (A) Schematic overview of siPool construction. SiRNA sequences are designed and arranged in tandem separated by specific spacer sequences. siPool transcripts are in vitro transcribed by T7 polymerase and annealed. The resulting siPool precursors contain complementary siRNA sequences flanked by single-stranded spacer regions. The spacer sequences allow RNase T1 digestion resulting in double-stranded siRNAs with 2 nt 3′ overhangs. (B) In vitro transcription and annealing of siPools. 600 ng (left) or 800 ng (right) in vitro transcribed (IVT) sense and antisense strands (lanes 1 and 2) were annealed to a double-stranded siPool precursor (lane 3), loaded onto a 5% native polyacrylamide gel (left) or on a 1% native agarose gel (right). (C) Comparison of purified siPools with a synthetic siRNA. 50, 100 or 200 ng of purified siPools (lanes 4–9) or a synthetic siRNA (lanes 1–3) was loaded onto a 20% native polyacrylamide gel and visualized by ethidium bromide staining. (D and E) HeLa cells were transfected with 1, 3 or 10 nM concentrations of siPools containing 15 siRNAs (pool 15 #1–4), a combination of all 15 siRNA-siPools resulting in a siPool containing 60 different siRNAs (pool 60) or specific siRNAs (#1–4) directed against PolG (D) or Scyl1 (E).
Figure 2.
Figure 2.
siPools efficiently knock down redundant gene family members. (A) HeLa cells were transfected with 3 or 10 nM concentrations of siPools targeting TNRC6A (‘A’, left panel), TNRC6B (‘B’, middle panel), TNRC6C (‘C’, right panel) or a combination of all three siPools (‘ABC’). Specific siRNAs against TNRC6A, TNRC6B or TNRC6C were transfected in similar concentrations. As a negative control for TNRC6 targeting siPools, an unspecific control siPool, and for siRNAs an unspecific control siRNA, was used. mRNA levels were measured by qPCR and normalized to GAPDH, and relative expression levels were calculated based on transfection of an unspecific control siPool or an unspecific control siRNA (ctrl.). (B) siPools specifically knock down individual family members. HeLa cells were transfected with 3 nM concentrations of siPools targeting TNRC6A (‘A’), TNRC6B (‘B’), TNRC6C (‘C’) or a combination of all three siPools (‘ABC’). mRNA levels of TNRC6A (left panel), TNRC6B (middle panel) or TNRC6C (right panel) were measured by qPCR and normalized to GAPDH. Relative expression levels were calculated based on transfection of an unspecific control siPool or an unspecific control siRNA (ctrl.). (C) Dual luciferase assay: HeLa cells were co-transfected with HMGA2 3′-UTR dual luciferase expression vector and with 3 or 10 nM siRNAs, or siPools targeting TNRC6A (T6A), TNRC6B (T6B), TNRC6C (T6C) or a combination of all siPools targeting TNRC6A, TNRC6B and TNRC6C (T6 ABC). As positive control we used a let-7a 2′OMe miRNA inhibitor which was normalized to an unspecific control 2′OMe inhibitor (ctrl.). Relative luciferase activity was calculated using the ratio for firefly/Renilla luciferase and via normalization to the corresponding ratios of an HMGA2 3′-UTR with mutated let-7a binding sites. All ratios were further normalized to a corresponding unspecific negative control (ctrl.) siPool or siRNA. (D) qPCR analysis of TNRC6A, TNRC6B and TNRC6C expression levels relative to GAPDH in HeLa cells.
Figure 3.
Figure 3.
Off-target activity of different siPools. (A) HeLa cells were transfected with 10 nM siPool 60. To validate that the specific off-T siRNAs are present in the pools, Ago2 was immunoprecipitated from the lysates and passenger and guide strands of PolG off-T (left) or Scyl1 off-T (right) siRNAs were analyzed by northern blotting. As positive controls, 3 pmol of total siPools and 2.5% input material were used. (B) HeLa cells were transfected with 1, 3 or 10 nM siPool 15 #1, siPool 60 or specific off-T siRNAs directed against PolG (blue) or Scyl1 (green). Mad2 mRNA levels were measured by qPCR and normalized to GAPDH. Relative expression levels were calculated based on transfection of an unspecific control siRNA (neg. ctrl.). (C) Experiment was performed as described in (B). MAD2 protein levels were analyzed by western blotting 48 h after transfection. A specific MAD2 siRNA served as a positive control (lanes 9 and 10). Actin expression levels were used as loading controls (lower panels). (D) HeLa cells were transfected with 3 or 10 nM siRNA off-T or siPools containing 15, 30, 45 or 60 different siRNAs directed against PolG (blue) or Scyl1 (green). Off-target activity was analyzed using MAD2 3′-UTR controlling firefly-luciferase activity. Relative luciferase activity was calculated using the ratio of firefly/Renilla luciferase and via normalization to the corresponding ratios of the empty control vector.
Figure 4.
Figure 4.
Global mRNA expression profiles upon siRNA transfection. HeLa cells were transfected with 3 nM of a Scyl1-targeting siRNA and siPools. (A) Differential mRNA expression in the single siRNA, pool of 15 sequences and pool of 60 sequences experiment. The horizontal axis shows the average expression level over siRNA-treated and control experiments, and the vertical axis shows the difference in expression between treated and control samples (log2 fold change). Transcripts differentially expressed at a q-value of 10−6 are highlighted in red, and all others are shown in gray. Scyl1 transcripts are highlighted in green, Mad2 (isoform MAD2L1 was targeted) in black. The siRNA experiment induces more genes to change expression levels than the pool experiments. The off-target MAD2L1 is significant differentially expressed in the siRNA experiment, but not in the pool experiments. (B) Enrichment of seed complementary sites in the 3′-UTRs of repressed transcripts. White bars show the number of repressed transcripts with a Scyl1 siRNA complementary seed sequence in the single siRNA (siRNA) and the pool of 15 (pool 15, bar labeled siPool15_1) and 60 sequences (pool 60, bar labeled siPool60_1). Gray bars show the mean number of repressed transcripts in the respective experiment with a complementary site to a random seed sequence. The enrichment in the single siRNA transfection experiment is significant with P << 0.001, while the same sequence as well as three additional randomly chosen sequences of the pools are not significantly enriched in the repressed transcripts. (C and D) Activity of single siRNAs as part of negative control siPools. HeLa cells were transfected with indicated concentrations in nM of Scyl off-T siRNA alone or mixed in an unspecific ctrl. siPool to an equal concentration of individual siRNAs of the siPool. IC50 values are depicted in the line graph (C); in addition, data are also shown in a bar graph (D). mRNA levels were measured via qPCR and normalized to GAPDH.
Figure 5.
Figure 5.
Comparison of siPools with other available RNAi reagents. qPCR analysis of on- (left panels in (A) and (B)) and off-target (right panels in (A) and (B)) activities of various siRNA tools. HeLa cells were transfected with 1 or 3 nM siPool 15, siPool 60, single off-T siRNA, esiRNAs and four different low-complexity pools directed against PolG (A) or Scyl1 (B). mRNA levels were normalized to GAPDH and relative expression levels were calculated using a negative control siRNA. Low-complexity pool #4 served as a MAD2 off-target negative control. (C) HeLa cells were transfected with 1, 3 or 10 nM siRNA off-T, siPools with 15 or 60 different siRNAs and four different low-complexity pools directed against PolG (blue) or Scyl1 (green). Off-target activity was analyzed using a reporter system based on firefly-luciferase activity controlled by the MAD2 3′-UTR. Relative luciferase activity was calculated using the ratio of firefly/Renilla luciferase and via normalization to the corresponding ratios of the empty control vector. Low-complexity pool #4 served as a MAD2 off-target negative control.
Figure 6.
Figure 6.
Analysis of interferon response induction. (A) 400 ng of esiRNAs or 200 ng siRNA pools both against Scyl1, PolG, Traf5 and Ago2 were loaded onto a 20% native PAA gel and stained with ethidium bromide. (B and C) MCF7 cells were transfected with 1, 10 or 30 nM siPools or corresponding esiRNAs against Scyl1 (B) or PolG (C). mRNA levels were normalized to GAPDH and relative expression levels were calculated using a negative control siPool. (D) MCF7 cells were transfected with 10 nM esiRNAs (left) or a siPool containing 60 siRNAs (right) against Scyl1. mRNA expression profiles were assessed using microarray.

References

    1. Dorsett Y., Tuschl T. siRNAs: applications in functional genomics and potential as therapeutics. Nat. Rev. Drug Discov. 2004;3:318–329. - PubMed
    1. Meister G., Tuschl T. Mechanisms of gene silencing by double-stranded RNA. Nature. 2004;431:343–349. - PubMed
    1. Siomi H., Siomi M.C. On the road to reading the RNA-interference code. Nature. 2009;457:396–404. - PubMed
    1. Iwasaki S., Kobayashi M., Yoda M., Sakaguchi Y., Katsuma S., Suzuki T., Tomari Y. Hsc70/Hsp90 chaperone machinery mediates ATP-dependent RISC loading of small RNA duplexes. Mol. Cell. 2010;39:292–299. - PubMed
    1. Hammond S.M., Boettcher S., Caudy A.A., Kobayashi R., Hannon G.J. Argonaute2, a link between genetic and biochemical analyses of RNAi. Science. 2001;293:1146–1150. - PubMed

Publication types

Associated data