. 2014 Jun;42(11):7210-25.
doi: 10.1093/nar/gku386. Epub 2014 May 29.

Analysis of tetra- and hepta-nucleotides motifs promoting -1 ribosomal frameshifting in Escherichia coli

Affiliations

Analysis of tetra- and hepta-nucleotides motifs promoting -1 ribosomal frameshifting in Escherichia coli

Virag Sharma et al. Nucleic Acids Res. 2014 Jun.

Abstract

Programmed ribosomal -1 frameshifting is a non-standard decoding process occurring when ribosomes encounter a signal embedded in the mRNA of certain eukaryotic and prokaryotic genes. This signal has a mandatory component, the frameshift motif: it is either a Z_ZZN tetramer or a X_XXZ_ZZN heptamer (where ZZZ and XXX are three identical nucleotides) allowing cognate or near-cognate repairing to the -1 frame of the A site or A and P sites tRNAs. Depending on the signal, the frameshifting frequency can vary over a wide range, from less than 1% to more than 50%. The present study combines experimental and bioinformatics approaches to carry out (i) a systematic analysis of the frameshift propensity of all possible motifs (16 Z_ZZN tetramers and 64 X_XXZ_ZZN heptamers) in Escherichia coli and (ii) the identification of genes potentially using this mode of expression amongst 36 Enterobacteriaceae genomes. While motif efficiency varies widely, a major distinctive rule of bacterial -1 frameshifting is that the most efficient motifs are those allowing cognate re-pairing of the A site tRNA from ZZN to ZZZ. The outcome of the genomic search is a set of 69 gene clusters, 59 of which constitute new candidates for functional utilization of -1 frameshifting.


Figures

Figure 1.
Figure 1.
Overall organization of known bacterial -1 frameshift signals. Codons in frame with the upstream initiation codon (frame 0) are separated with underscores; their position relative to the ribosomal E, P and A sites and their tRNAs, at the onset of frameshifting is indicated.
Figure 2.
Figure 2.
Reporter plasmid and sequence of the three contexts in which the frameshifting propensity of the X_XX.Z_ZZ.N heptamers was assessed. Plasmid pOFX310 (panel A) was used to clone between a HindIII and an ApaI site the three frameshift windows shown in panels B–D. The no-stimulator construct (panel B) was derived from the IS911 construct (panel C) (48) by deletion of most of the stem-loop and mutation to CCUC of the SD-like GGAG sequence. The IS3 construct (panel D) was engineered by replacing the IS911 stem-loop with the PK from IS3 (4) and by mutating to CCUC the stimulatory SD.
Figure 3.
Figure 3.
Frameshift efficiency of the Z_ZZ.N tetramers. The IS3 frameshift region cloned in plasmid pOFX310 was the one used in a previous study [see Figure 1 in (19)]. It differs slightly from the one used for the heptamer analysis (Figure 2, panel D). The nucleotides upstream (6 nt) and downstream (5 nt) of the motif are those found in IS3. The sequence from the HindIII site to the start of the PK is agcuuCCUCCAZZZNGCCGC—. The no-stimulator construct was derived by deleting the 3′ half of the PK, right after the UGA stop codon in the 0 frame, to give the following sequence: agcuuCCUCCAZZZNGCCGCGACAUACUUCGCGAAGGCCUGAACUUGAAgggcc. The four frameshifting values for each motif correspond to a construct with a motif and the IS3 PK (open circles), a construct without motif and with the IS3 PK (open lozenges), a construct with motif and without stimulator (black inverted triangles) and a construct without motif and stimulator (open triangles). Each frameshifting value is the mean of five independent determinations (the ± standard deviation intervals were omitted because they are not bigger than the size of the symbols in most cases). The no-motif constructs were derived by changing each motif to either G_YY.N or C_RR.N.
Figure 4.
Figure 4.
Frameshift efficiency of the X_XXZ_ZZN heptamers. There are five frameshifting values for each motif corresponding to constructs with a motif and the IS3 PK (open circles), with a motif and the IS911 stimulators (black lozenges), without a motif and with the IS911 stimulators (open lozenges), with a motif and without stimulator (inverted grey triangles) and without both motif and stimulator (open triangles) (Figure 2). Each frameshifting value is the mean of five independent determinations (the ±standard deviation intervals were not added because they are not bigger than the size of the symbols). The no-motif constructs were obtained by changing the first and fourth nucleotides of each motif as detailed in Materials and Methods.
Figure 5.
Figure 5.
Distribution of Z_ZZ.N and X_XX.Z_ZZ.N motifs in mobile elements from the IS1 and IS3 families. These two families were selected because biologically relevant -1 frameshifting was demonstrated in both (4,10). The sequences of the IS from these 2 families (63 entries for the IS1 family and 494 for the IS3 family), obtained from the ISFinder database (October 2012), were examined for the presence of potential frameshift signals (i.e. existence of 2 overlapping ORFs, with the second being in the -1 frame relative to the first and presence of a Z_ZZ.N or X_XX.Z_ZZ.N motif in the overlap region; the Z_ZZN motifs scored in panel B are those which are not part of an X_XX.Z_ZZ.N heptamer). The relative frameshifting frequencies of the motifs found are indicated in the right-hand panels. All values were normalized relative to that of the best motif (A_AA.G or C_CC.A_AA.G), using data from Figures 3 and 4.
Figure 6.
Figure 6.
Distribution of the X_XXY_YYZ heptameric patterns across the nrMEG (black discs) and their spread across the 1000 randomized genomes (violins). The violin plots are a combination of a box plot and a kernel density plot where the width of the box is proportional to the number of data points in that box (45). The open circle in each violin correspond to the median, the thick vertical lines (often masked by the open circle) around the median represent the Inter Quartile Range while the thinner vertical lines that run through most of the violin plot represent 95% confidence intervals.
Figure 7.
Figure 7.
Plot of the z-score for all X_XX.Z_ZZ.N motifs in the nrMEG (panel A) or in the HEGome (panel B) against the frameshifting efficiency in the absence of stimulatory element. Note that the much larger z-values observed in (A) compared with (B) result from the much larger gene set being analysed in the former (leading to lower relative errors in what is essentially a Poisson system).
Figure 8.
Figure 8.
Overview of the proteins produced by normal translation or by -1 frameshifting for one gene typical of each of the 69 clusters of genes selected on the basis of high conservation of an X_XX.Z_ZZ.N motif in the nrMEG. The selection pipeline is indicated in Materials and Methods and the properties of each cluster are given in Supplementary Table S4–S6. The data of Supplementary Table S6 relative to the size of the protein products were plotted as follows. Panel A shows the size in amino acids of the full-length frame 0 protein as a function of the cluster order presented in the first column of Supplementary Table S6 (clusters were ordered by increasing value of the size ratio between the frameshift product and the frame 0 protein). Panel B, presents the size variation of the -1 frameshift product (circles) and of the normal, frame 0, translation product up to the end of the X_XX.Z_ZZ.N motif (triangles) (all sizes are relative to that of the corresponding full-length frame 0 product) as a function of the cluster order shown in the first column of Supplementary Table S6. The 10 demonstrated cases of frameshifting are indicated on each panel as true PRF-1 and dnaX or IS and phages (details about these clusters can be found in Supplementary Tables S4 and S5). Panel C summarizes qualitatively the features of each of the 69 clusters. Each square represents a cluster, and the features (absence of stimulator, presence of an upstream SD or of a downstream structure, existence of a -1 protein longer than the 0 frame product and demonstration of -1 PRF) are symbolized as indicated below the panel. Clusters in the two upper boxes are those displaying reduced variability at synonymous sites (rvss+; see Materials and Methods, Supplementary Tables S4 and S5) and clusters in the two lower boxes are those without reduced variability (rvss).
Figure 9.
Figure 9.
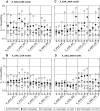
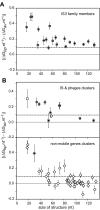
Summary of the in silico search of conserved hairpin structures constituting potential frameshift stimulators (see Materials and Methods). The x-axis indicates the size in nucleotide of the hairpin structure and the y-axis shows the ΔΔG.nt−1 parameter, which is the difference between the mean ΔGunfold per nucleotide of the conserved hairpin (ΔGhp.nt−1, kcal.mol−1.nt−1) and the average ΔGunfold of structures predicted in a sliding window, of the same size as the corresponding conserved hairpin, moved over a 197 nt segment starting 4 nt after the motif (ΔGav, kcal.mol−1) (see also Supplementary Table S8); the error bar correspond to the standard deviation for that difference. The symbols with a central black dot indicate genes for which PRF-1 is demonstrated or very likely. Part A shows the results for a set of IS3 family members, namely (and ranked according to the size of the structure): IS3411, ISAca1, ISSusp2, IS3, IS1221A, ISBcen23, ISPae1, ISPsy11, ISBmu11, ISPosp5, ISBcen22, ISBam1, ISHor1, ISXca1, ISL1, ISDde4, ISBlma5, ISSpwi1, ISNisp3 and ISRle5. The dotted line is set at the lowest ΔΔG.nt−1 value (0.09 kcal.mol−1.nt−1) found for ISPsy1. Part B shows the ΔΔG.nt−1 results for 53 gene clusters, out of the 69, that have a conserved hairpin. The IS (circles) and phage (squares) clusters are in the upper panel and the non-mobiles genes clusters in the bottom panel.

References

    1. Jacks T., Varmus H. Expression of the Rous sarcoma virus pol gene by ribosomal frameshifting. Science. 1985;230:1237–1242. - PubMed
    1. Jacks T., Madhani H.D., Masiarz F.R., Varmus H.E. Signals for ribosomal frameshifting in the Rous sarcoma virus gag-pol region. Cell. 1988a;55:447–458. - PMC - PubMed
    1. Jacks T., Power M., Masiarz F., Luciw P., Barr P., Varmus H. Characterization of ribosomal frameshifting in HIV-1 gag-pol expression. Nature. 1988b;331:280–283. - PubMed
    1. Sekine Y., Ohtsubo E. Frameshifting is required for production of the transposase encoded by insertion sequence 1. Proc. Natl. Acad. Sci. 1989;86:4609–4613. - PMC - PubMed
    1. Tsuchihashi Z., Kornberg A. Translational frameshifting generates the gamma subunit of DNA polymerase III holoenzyme. Proc. Natl. Acad. Sci. 1990;87:2516–2520. - PMC - PubMed

Publication types