The strength of the template effect attracting nucleotides to naked DNA
- PMID: 24875480
- PMCID: PMC4066754
- DOI: 10.1093/nar/gku314
The strength of the template effect attracting nucleotides to naked DNA
Abstract
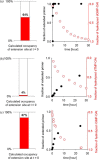
The transmission of genetic information relies on Watson-Crick base pairing between nucleoside phosphates and template bases in template-primer complexes. Enzyme-free primer extension is the purest form of the transmission process, without any chaperon-like effect of polymerases. This simple form of copying of sequences is intimately linked to the origin of life and provides new opportunities for reading genetic information. Here, we report the dissociation constants for complexes between (deoxy)nucleotides and template-primer complexes, as determined by nuclear magnetic resonance and the inhibitory effect of unactivated nucleotides on enzyme-free primer extension. Depending on the sequence context, Kd's range from 280 mM for thymidine monophosphate binding to a terminal adenine of a hairpin to 2 mM for a deoxyguanosine monophosphate binding in the interior of a sequence with a neighboring strand. Combined with rate constants for the chemical step of extension and hydrolytic inactivation, our quantitative theory explains why some enzyme-free copying reactions are incomplete while others are not. For example, for GMP binding to ribonucleic acid, inhibition is a significant factor in low-yielding reactions, whereas for amino-terminal DNA hydrolysis of monomers is critical. Our results thus provide a quantitative basis for enzyme-free copying.
© The Author(s) 2014. Published by Oxford University Press on behalf of Nucleic Acids Research.
Figures


Similar articles
-
The effect of leaving groups on binding and reactivity in enzyme-free copying of DNA and RNA.Nucleic Acids Res. 2016 Jul 8;44(12):5504-14. doi: 10.1093/nar/gkw476. Epub 2016 May 27. Nucleic Acids Res. 2016. PMID: 27235418 Free PMC article.
-
Studies on the effects of truncating alpha-helix E' of p66 human immunodeficiency virus type 1 reverse transcriptase on template-primer binding and fidelity of DNA synthesis.Biochemistry. 1998 Nov 24;37(47):16636-44. doi: 10.1021/bi981830g. Biochemistry. 1998. PMID: 9843431
-
Templating efficiency of naked DNA.Proc Natl Acad Sci U S A. 2010 Jul 6;107(27):12074-9. doi: 10.1073/pnas.0914872107. Epub 2010 Jun 16. Proc Natl Acad Sci U S A. 2010. PMID: 20554916 Free PMC article.
-
Enzyme-free genetic copying of DNA and RNA sequences.Beilstein J Org Chem. 2018 Mar 12;14:603-617. doi: 10.3762/bjoc.14.47. eCollection 2018. Beilstein J Org Chem. 2018. PMID: 29623122 Free PMC article. Review.
-
Protein-nucleic acid interactions and DNA conformation in a complex of human immunodeficiency virus type 1 reverse transcriptase with a double-stranded DNA template-primer.Biopolymers. 1997;44(2):125-38. doi: 10.1002/(SICI)1097-0282(1997)44:2<125::AID-BIP2>3.0.CO;2-X. Biopolymers. 1997. PMID: 9354757 Review.
Cited by
-
Enzyme-Free Copying of 12 Bases of RNA with Dinucleotides.Angew Chem Int Ed Engl. 2022 Jul 18;61(29):e202203067. doi: 10.1002/anie.202203067. Epub 2022 May 5. Angew Chem Int Ed Engl. 2022. PMID: 35445525 Free PMC article.
-
Copying of RNA Sequences without Pre-Activation.Angew Chem Int Ed Engl. 2015 Nov 23;54(48):14559-63. doi: 10.1002/anie.201506592. Epub 2015 Oct 5. Angew Chem Int Ed Engl. 2015. PMID: 26435291 Free PMC article.
-
Enzyme-free ligation of dimers and trimers to RNA primers.Nucleic Acids Res. 2019 May 7;47(8):3836-3845. doi: 10.1093/nar/gkz160. Nucleic Acids Res. 2019. PMID: 30869145 Free PMC article.
-
pH-controlled DNA- and RNA-templated assembly of short oligomers.Chem Sci. 2015 Jan 1;6(1):542-547. doi: 10.1039/c4sc03028a. Epub 2014 Oct 28. Chem Sci. 2015. PMID: 28936308 Free PMC article.
-
A Highly Reactive Imidazolium-Bridged Dinucleotide Intermediate in Nonenzymatic RNA Primer Extension.J Am Chem Soc. 2016 Sep 14;138(36):11996-2002. doi: 10.1021/jacs.6b07977. Epub 2016 Sep 1. J Am Chem Soc. 2016. PMID: 27552367 Free PMC article.
References
-
- Kornberg A., Baker T.A. DNA Replication. 2nd edn. Mill Valley, CA: University Science Books; 2005.
-
- Woese C.R. The Genetic Code; The Molecular Basis For Genetic Expression. New York, NY: Harper & Row; 1967.
-
- Kunkel T.A., Bebenek R. DNA replication fidelity. Annu. Rev. Biochem. 2000;69:497–529. - PubMed
-
- Bryant F.R., Johnson K.A., Benkovic S.J. Elementary steps in the DNA-polymerase-I reaction pathway. Biochemistry. 1983;22:3537–3546. - PubMed
-
- Doublie S., Tabor S., Long A.M., Richardson C.C., Ellenberger T. Crystal structure of a bacteriophage T7 DNA replication complex at 2.2 A resolution. Nature. 1998;391:251–258. - PubMed
Publication types
MeSH terms
Substances
LinkOut - more resources
Full Text Sources
Other Literature Sources

