. 2014 May 29;9(5):e98468.
doi: 10.1371/journal.pone.0098468. eCollection 2014.

Differences in supraspinal and spinal excitability during various force outputs of the biceps brachii in chronic- and non-resistance trained individuals

Affiliations

Differences in supraspinal and spinal excitability during various force outputs of the biceps brachii in chronic- and non-resistance trained individuals

Gregory E P Pearcey et al. PLoS One. .

Abstract

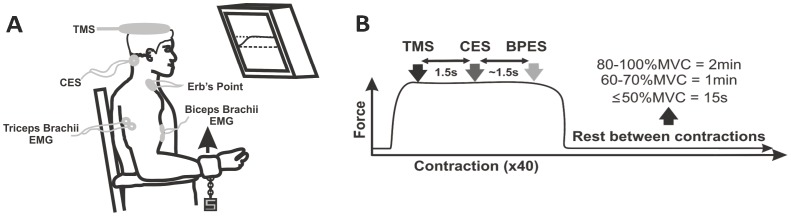
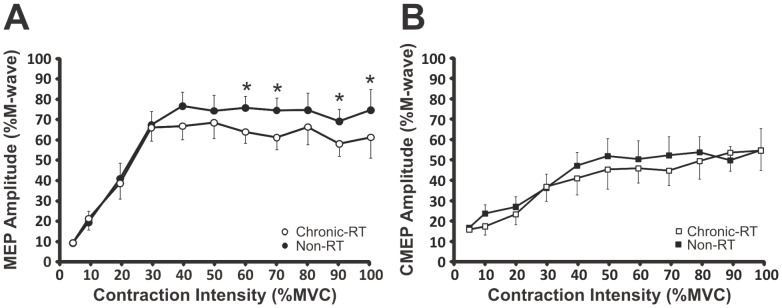
Motor evoked potentials (MEP) and cervicomedullary evoked potentials (CMEP) may help determine the corticospinal adaptations underlying chronic resistance training-induced increases in voluntary force production. The purpose of the study was to determine the effect of chronic resistance training on corticospinal excitability (CE) of the biceps brachii during elbow flexion contractions at various intensities and the CNS site (i.e. supraspinal or spinal) predominantly responsible for any training-induced differences in CE. Fifteen male subjects were divided into two groups: 1) chronic resistance-trained (RT), (n = 8) and 2) non-RT, (n = 7). Each group performed four sets of ∼5 s elbow flexion contractions of the dominant arm at 10 target forces (from 10%-100% MVC). During each contraction, subjects received 1) transcranial magnetic stimulation, 2) transmastoid electrical stimulation and 3) brachial plexus electrical stimulation, to determine MEP, CMEP and compound muscle action potential (Mmax) amplitudes, respectively, of the biceps brachii. All MEP and CMEP amplitudes were normalized to Mmax. MEP amplitudes were similar in both groups up to 50% MVC, however, beyond 50% MVC, MEP amplitudes were lower in the chronic RT group (p<0.05). CMEP amplitudes recorded from 10-100% MVC were similar for both groups. The ratio of MEP amplitude/absolute force and CMEP amplitude/absolute force were reduced (p<0.012) at all contraction intensities from 10-100% MVC in the chronic-RT compared to the non-RT group. In conclusion, chronic resistance training alters supraspinal and spinal excitability. However, adaptations in the spinal cord (i.e. motoneurone) seem to have a greater influence on the altered CE.


Conflict of interest statement

Competing Interests: The authors have declared that no competing interests exist.

Figures

Figure 1
Figure 1. Experimental protocol.
(A) Schematic diagram of experimental apparatus for elbow flexion from 10–100% MVC and stimulation location. (B) Subjects performed 4 sets of 10–100% MVCs (40 contractions in total) and received transcranial magnetic stimulation of the motor cortex (black arrow, at 1.0 s), cervicomedullary electrical stimulation of the corticospinal tracts (white arrow, at 2.5 s) and brachial plexus electrical stimulation (Erb's point) of the peripheral nerve (grey arrow, at 4.0 s) following the onset of muscle contraction. The amount of rest given between contractions depended on the contraction intensity (i.e. percentage of MVC) and is illustrated at the far right.
Figure 2
Figure 2. Force output from 10–100% MVC and corticospinal responses of the biceps brachii recorded from a chronic-RT subject.
(A) Individual raw data traces from a single subject of one set of contractions from 10–100% MVC with the three stimuli: transcranial magnetic (MEP), cervicomedullary (CMEP) and brachial plexus stimulation (M-wave). Additional force is superimposed on the actual force following each stimulus at each contraction intensity. (B) Individual raw data traces from the same subject showing EMG responses (MEP-top, CMEP-middle, and M-wave-bottom) of the biceps brachii following each stimulus. Arrows indicate the time of stimulation.
Figure 3
Figure 3. Consistency of the elbow flexion force tracing procedure and corticospinal responses in the biceps brachii within and between set contractions recorded from a chronic-RT subject.
Individual raw data traces from a single subject for 4 contractions across four sets at 40% MVC (TOP). Individual raw data traces from the same subject showing EMG responses of the biceps brachii following each stimulus (transcranial magnetic - MEP, cervicomedullary - CMEP and brachial plexus - M-wave) for the 4 contractions (middle). Boxes were placed around the MEP, CMEP and M-wave and magnified for clearer illustration (bottom). MEPs, CMEPs and M-waves were very consistent within each contraction and between set contractions at the same relative intensity. Since TMS and TMES were triggered at 1 s and 2.5 s, respectively during all contraction intensities, MEPs and CMEPs overlap in the EMG Waveform. Erb's point stimulation was manually triggered at ∼4 s thus M-waves do not overlap. In the magnified M-wave waveform, M-waves from each contraction were matched by the onset of stimulus artifact.
Figure 4
Figure 4. Elbow flexion force over all contraction intensities.
Absolute-relative target force relationship of the elbow flexors. The slopes and r values are illustrated for each group. Each data point represents the group means ± SE. * Indicates significant (p≤0.032) differences between groups.
Figure 5
Figure 5. Between group differences in corticospinal responses (A) MEPs and (B) CMEPs of the biceps brachii during elbow flexion from 10-100% MVC.
Each data point represents group means ± SE. * Indicates a significant (p≤0.043) difference between groups.
Figure 6
Figure 6. Between group differences in corticospinal responses (A) MEPs and (B) CMEPs of the biceps brachii normalized to absolute elbow flexion forces from 10–100% MVC.
Each data point represents group means ± SE. * Indicates a significant (p≤0.015) difference between groups.
Figure 7
Figure 7. Biceps brachii activation during muscle contraction from 10–100% MVC.
(A) Normalized rmsEMG to absolute elbow flexion forces recorded from 10–100%MVC. (B) Muscle coactivation (EMG of triceps:biceps brachii) 10–100% MVC. Each data point represents group means ± SE. * Indicates a significant (p≤0.041 and p<0.001 for activation and coactivation, respectively) difference between groups. Ł Indicates a trend (p≤0.075) for between group differences.

Similar articles

Cited by

References

    1. Folland JP, Williams AG (2007) The adaptations to strength training: morphological and neurological contributions to increased strength. Sports Med 37: 145–168. - PubMed
    1. Del Balso C, Cafarelli E (2007) Adaptations in the activation of human skeletal muscle induced by short-term isometric resistance training. J Appl Physiol (1985) 103: 402–411. - PubMed
    1. Carroll TJ, Selvanayagam VS, Riek S, Semmler JG (2011) Neural adaptations to strength training: moving beyond transcranial magnetic stimulation and reflex studies. Acta physiologica 202: 119–140. - PubMed
    1. Carroll TJ, Riek S, Carson RG (2001) Neural adaptations to resistance training: implications for movement control. Sports medicine 31: 829–840. - PubMed
    1. Carroll TJ, Riek S, Carson RG (2002) The sites of neural adaptation induced by resistance training in humans. The Journal of physiology 544: 641–652. - PMC - PubMed

Publication types

LinkOut - more resources