. 2014 May 29;10(5):e1004371.
doi: 10.1371/journal.pgen.1004371. eCollection 2014.

Ribosomal protein mutations induce autophagy through S6 kinase inhibition of the insulin pathway

Affiliations

Ribosomal protein mutations induce autophagy through S6 kinase inhibition of the insulin pathway

Harry F Heijnen et al. PLoS Genet. .

Abstract

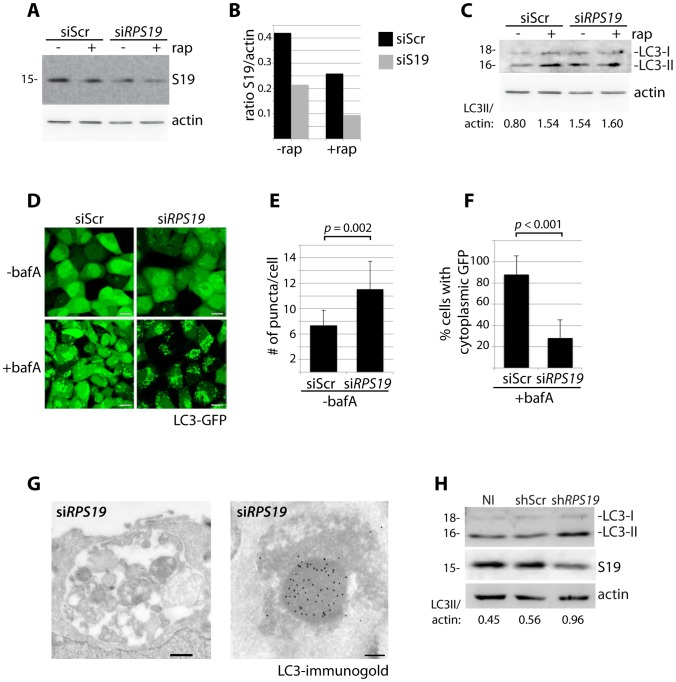
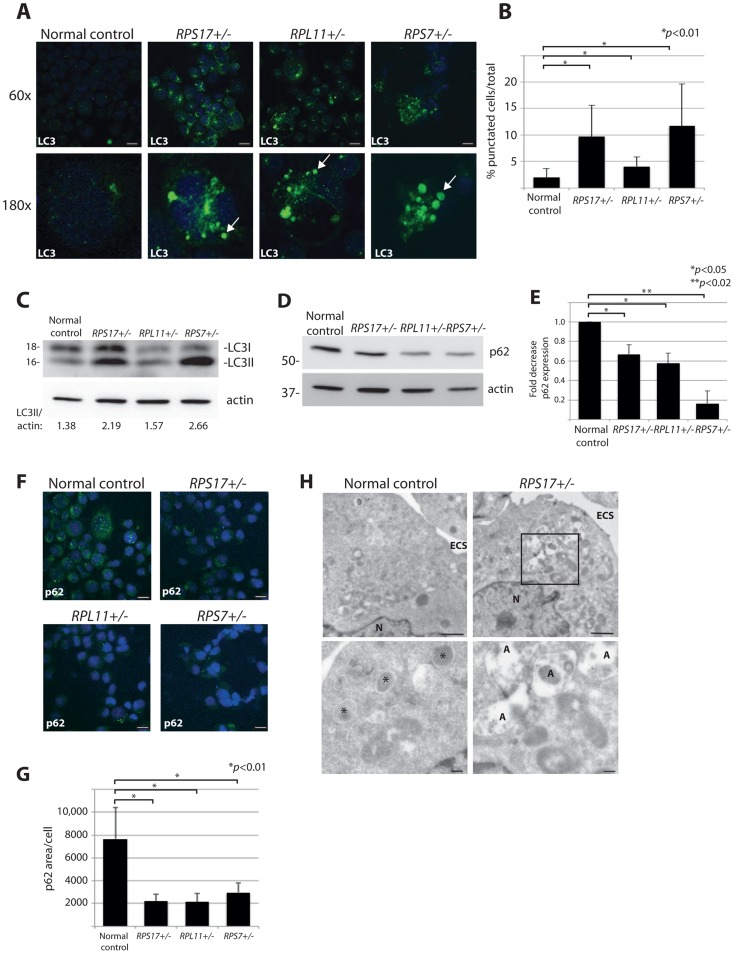
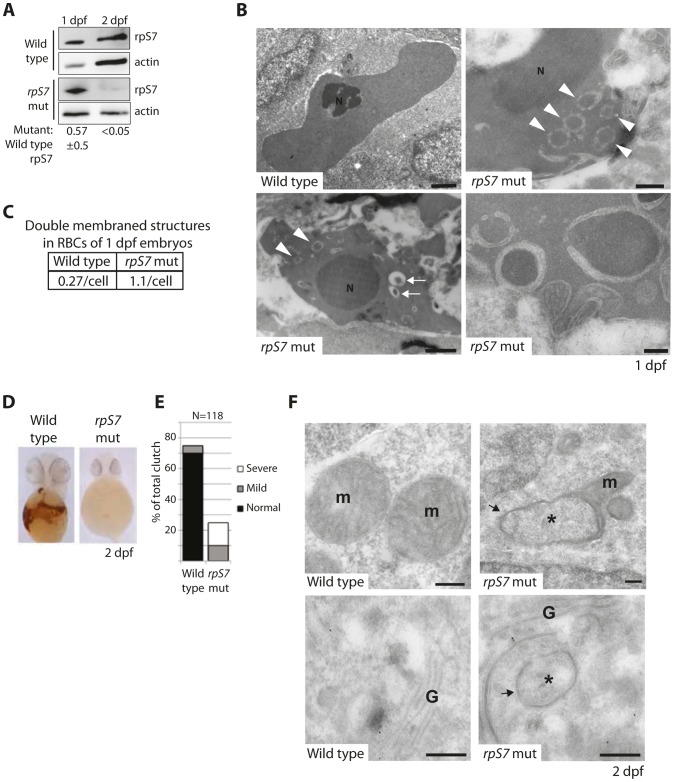
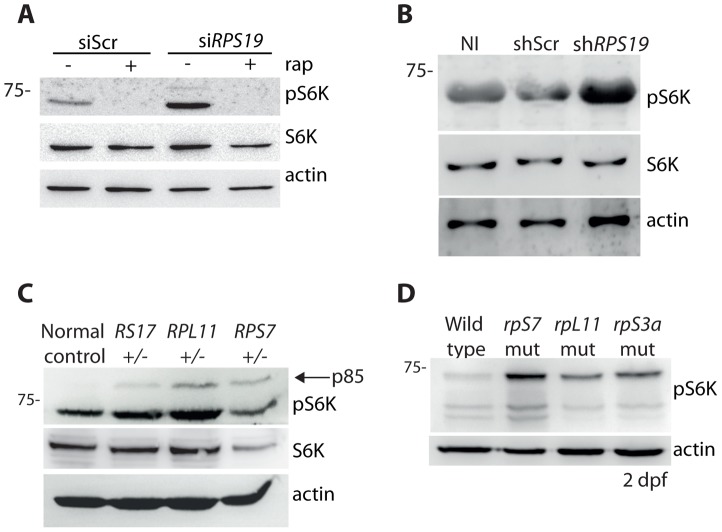
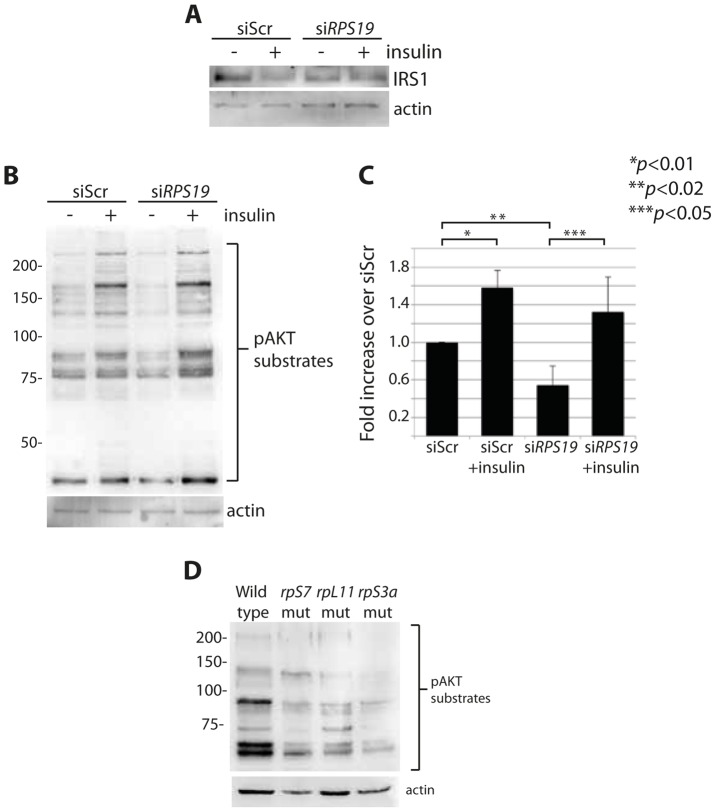
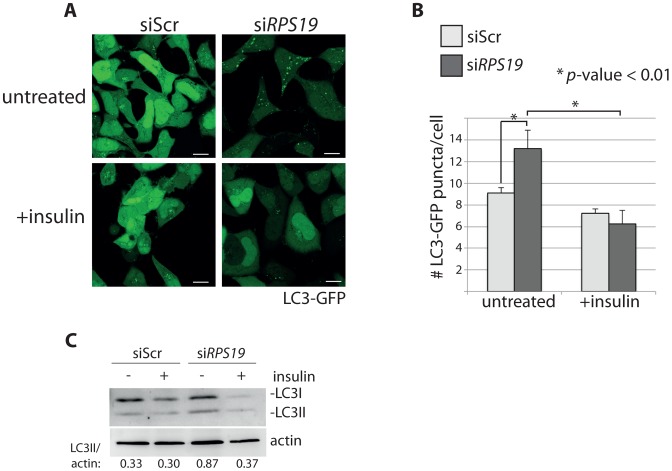
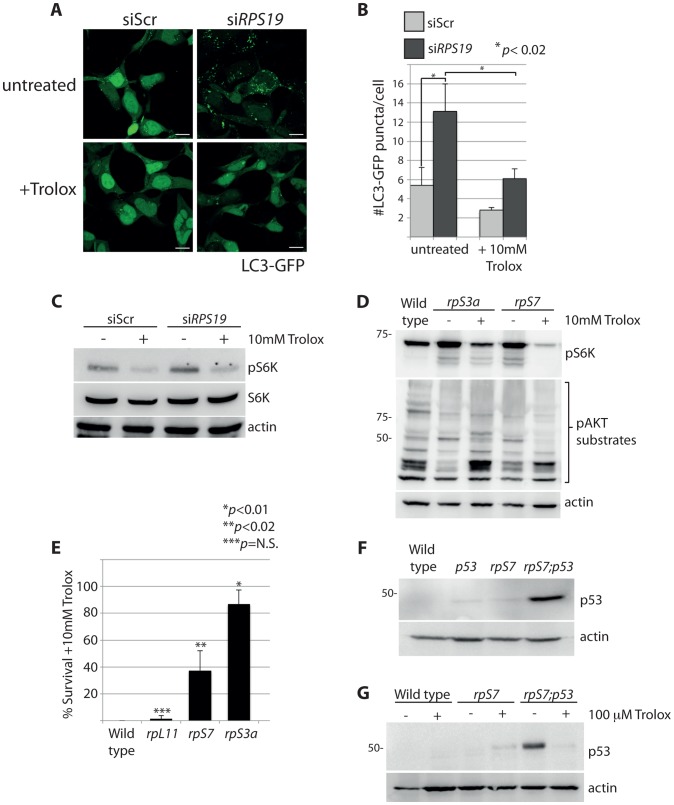
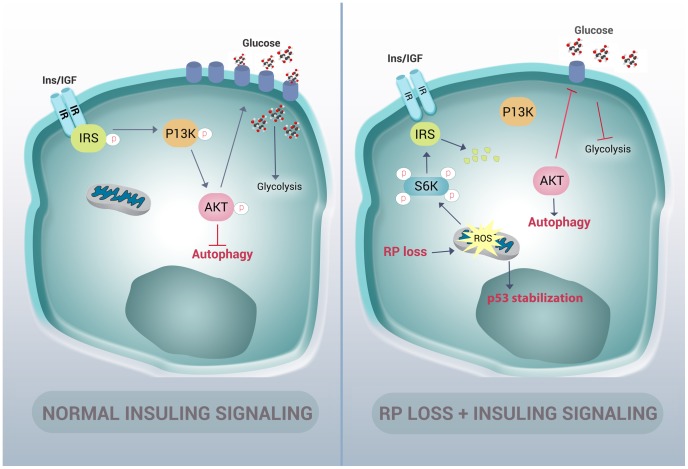
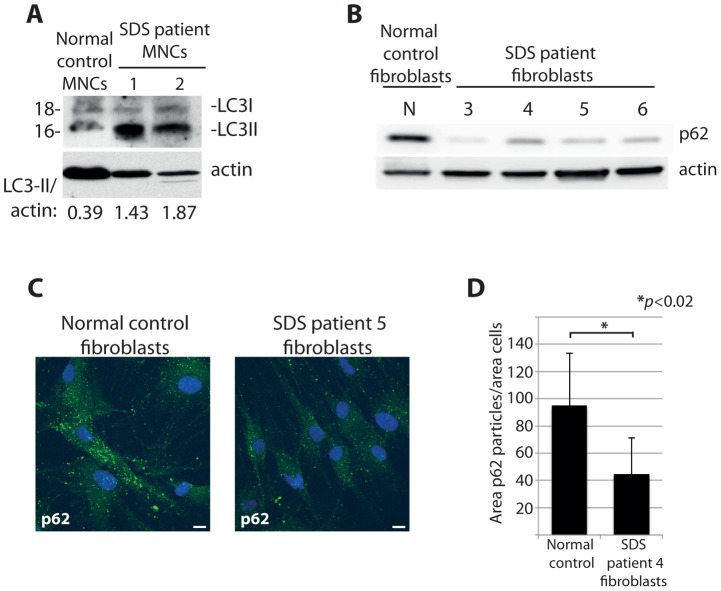
Mutations affecting the ribosome lead to several diseases known as ribosomopathies, with phenotypes that include growth defects, cytopenia, and bone marrow failure. Diamond-Blackfan anemia (DBA), for example, is a pure red cell aplasia linked to the mutation of ribosomal protein (RP) genes. Here we show the knock-down of the DBA-linked RPS19 gene induces the cellular self-digestion process of autophagy, a pathway critical for proper hematopoiesis. We also observe an increase of autophagy in cells derived from DBA patients, in CD34+ erythrocyte progenitor cells with RPS19 knock down, in the red blood cells of zebrafish embryos with RP-deficiency, and in cells from patients with Shwachman-Diamond syndrome (SDS). The loss of RPs in all these models results in a marked increase in S6 kinase phosphorylation that we find is triggered by an increase in reactive oxygen species (ROS). We show that this increase in S6 kinase phosphorylation inhibits the insulin pathway and AKT phosphorylation activity through a mechanism reminiscent of insulin resistance. While stimulating RP-deficient cells with insulin reduces autophagy, antioxidant treatment reduces S6 kinase phosphorylation, autophagy, and stabilization of the p53 tumor suppressor. Our data suggest that RP loss promotes the aberrant activation of both S6 kinase and p53 by increasing intracellular ROS levels. The deregulation of these signaling pathways is likely playing a major role in the pathophysiology of ribosomopathies.


Conflict of interest statement

The authors have declared that no competing interests exist.

Figures

Figure 1
Figure 1. Knock down of RPS19 induces autophagy.
(A) Western blot analysis of RPS19 expression in GFP-LC3 HEK cells transfected with siScr or siRPS19 and either untreated or treated with 100 nM rapamycin overnight (B). Densitometer analysis of the ratio of RPS19 to actin expression from Fig. 1A. (C) Western blot analysis of LC3 expression in GFP-LC3 HEK cells transfected with siScr or siRPS19 either untreated or treated with 100 nM rapamycin overnight. (D) Confocal analysis of GFP-LC3 HEK cells transfected with siScr or siRPS19 and either untreated or treated with 50 nM bafilomycin A for 4 hours. Size bars = 10 µM. (E) Quantification of the number of GFP-LC3 puncta per cell from Fig. 1D. At least 8 shots from 3 independent transfections are quantified. (F) Quantification of the percent of cells in Fig. 1D with cytoplasmic GFP-LC3. (G) Representative electron micrographs of GFP-LC3 HEK cells transfected with siRPS19 and immunogold labeled with LC3 antibodies. Size bar on left panel = 500 nM, on right panel = 200 nM. (H) Western blot analysis of LC3 expression in CD34+ cells either not infected (NI), infected with a scrambled control (shScr) or infected with a shRNA against RPS19 (shRPS19).
Figure 2
Figure 2. DBA mutations induce autophagy.
(A) Immunofluorescence with LC3 antibodies in LCLs derived from a normal control or DBA patients. Higher magnifications are represented in the lower panel. Arrows denote puncta indicative of LC3 recruitment to autophagosomes, or accumulation in autolysosomes. Size bars = 10 µM. (B) Quantification of the percent of cells revealing LC3 puncta compared to the total number of cells in the 60x shots. (C) Western blot analysis of LC3 in DBA LCLs compared to normal controls. The LC3II/actin ratio is determined by densitometer analysis. (D) Representative western blot analysis of p62 levels in normal control and DBA patient LCLs. (E) Densitometer analysis of p62 protein expression from western blots (N = 3) represented in (D). (F) Immunofluorescence with p62 antibodies of LCLs derived from a normal control or DBA patients. Size bars = 10 µM. (G) ImageJ measurements of p62 expression in (F) per total cell area. (H) Representative electron micrographs of LCLs derived from a normal control and RPS17 cells. Control cells have small typically dense lysosomes (*). The much larger autolysosomes (A) are only detected in RPS17 LCLs. The boxed area in the upper right panel is shown at higher magnification in the lower right panel. N = nucleus, ECS = extracellular space. Bars in top panels = 1 µM, bottom panels = 200 nM.
Figure 3
Figure 3. Reduction of rpS7 to haploinsufficient levels in zebrafish embryos induces autophagy in RBCs.
(A) Western blot analysis of rpS7 protein levels in zebrafish carrying viral inserts in the rpS7 gene at 1 and 2 dpf. The amount of rpS7 is calculated by densitometer analysis measuring the rpS7/actin ratio (N = 3). (B) Electron micrographs of 1 dpf embryos. Representative morphology of RBCs is shown in wild type (upper left panel) and rpS7-deficient embryos (upper right and lower panels). Arrowheads indicate double-membrane autophagosomes, arrows indicate autolysosomes. N = nucleus. Size bars upper and bottom left panels = 1 µM, upper right = 500 nM, lower right = 200 nM. (C) Quantification of double-membrane structures in the RBCs of micrographs in (B). In each case 28 cells were examined. (D) O-dianisidine staining of embryos at 2 dpf. Embryos (N>100) were scored in (E) and genotyped to confirm mutation status. (F) Representative mitochondrial morphology (m) displayed in wild type (upper left panel) and rpS7-deficient embryos at 2dpf (upper right). Typical Golgi complex (G) in wild type embryos shown (lower left panel) compared to Golgi complex in rpS7-deficient embryos (lower right). Arrows denote double membranes sequestering cytosolic material, an indication for autophagosome formation. *Denotes engulfed cytoplasmic material. Size bars = 200 nM.
Figure 4
Figure 4. RP loss increases phospo-S6 kinase signaling.
(A) Western blot analysis showing the expression of phosphorylated S6 kinase in GFP-LC3 HEK cells transfected with siScr or siRPS19 and either untreated or treated with 100 nM rapamycin overnight. (B) Western blot analysis of phosphorylated S6 kinase expression in CD34+ cord blood cells infected with a control shRNA (shScr) or an shRNA against RPS19 (shRPS19). (C) Western blot analysis of phosphorylated S6 kinase expression in LCLs derived from a normal control or DBA patients. (D) Western blot analysis of phosphorylated S6 kinase expression in 2 dpf zebrafish embryos.
Figure 5
Figure 5. RP loss results in a decrease of IRS1 and phosphorylated AKT substrates.
(A) Western blot analysis of IRS1 in GFP-LC3 HEK cells transfected with siScr or siRPS19. (B) Western blot analysis of phosphorylated AKT substrates in GFP-LC3 HEK cells transfected with siScr or siRPS19 and either untreated or stimulated with 350 nM insulin for 6 hours. (C) Densitometer analysis of the total expression level of phosphorylated AKT substrates in (B). (D) Western blot analysis of phosphorylated AKT substrates in 2 dpf zebrafish embryos.
Figure 6
Figure 6. Insulin abolishes autophagy in cells with RPS19 loss.
(A) Confocal microscopy analysis of GFP-LC3 HEK cells transfected with siScr or siRPS19 and either untreated or stimulated with 350 nM insulin for 6 hours. Size bars = 10 µM. (B) Quantification of the average number of GFP-LC3 puncta per cell in (A). (C) Western blot analysis of LC3 expression in cells from (A). Densitometer analysis used to calculate the ratio of LC3II/actin.
Figure 7
Figure 7. S6 kinase phosphorylation and autophagy is induced by reactive oxygen species (ROS).
(A) Confocal microscopy analysis of GFP-LC3 HEK cells transfected with siScr or siRPS19 and either untreated or treated with 10 mM Trolox overnight. Size bars = 10 µM. (B) Quantification of the average number of GFP-LC3 puncta per cell in (A). (C) Western blot analysis of phosphorylated S6 kinase expression in GFP-LC3 HEK transfected with siScr or siRPS19 and either untreated or treated with 10 mM Trolox overnight. (D) Western blot analysis of phosphorylated S6 kinase and phosphorylated AKT substrate expression in 2 dpf zebrafish embryos untreated or treated with 10 mM Trolox overnight. (E) Survival rates of embryos treated overnight with 10 mM Trolox. The results are the compilation of three independent experiments with N = 25 embryos representing each mutation. The statistics shown are compared to wild type. (F) Analysis of p53 stabilization in 2 dpf wild type, rpS7-deficient embryos, p53M214K/M214K mutant embryos, or double mutants (rpS7;p53) by western blotting. (G) Analysis of p53 stabilization by western blotting of zebrafish mutants treated overnight with 100 µM Trolox.
Figure 8
Figure 8. Graphic representation of how RP mutations result in autophagy and insulin pathway inhibition.
In normal cells, insulin signals through the insulin receptor substrate (IRS) to the PI3-kinase/AKT pathway in a manner that inhibits autophagy and increases the expression of glucose transporters on the cell membrane. In cells with RP loss, an increase of ROS stabilizes p53 and induces phosphorylation of S6 kinase. This hyper-phosphorylation of S6 kinase results in degradation of IRS and a decrease of insulin signaling to PI3-kinase and AKT. This loss of AKT activation in turn releases the inhibition of autophagy and reduces glycolysis.
Figure 9
Figure 9. Cells from SDS patients reveal increased autophagy.
(A) Western blot analysis of LC3 in primary MNCs isolated from two independent SDS patient peripheral blood. (B) Western blot analysis of p62 levels in primary fibroblasts isolated from four independent SDS patients. (C) Confocal analysis of p62 levels in SDS fibroblasts, quantified in (D). At least 8 shots from 3 independent experiments are quantified.

Similar articles

Cited by

References

    1. Narla A, Ebert BL (2010) Ribosomopathies: human disorders of ribosome dysfunction. Blood 115: 3196–3205. - PMC - PubMed
    1. Ebert BL, Pretz J, Bosco J, Chang CY, Tamayo P, et al. (2008) Identification of RPS14 as a 5q- syndrome gene by RNA interference screen. Nature 451: 335–339. - PMC - PubMed
    1. Boria I, Garelli E, Gazda HT, Aspesi A, Quarello P, et al. (2010) The ribosomal basis of Diamond-Blackfan Anemia: mutation and database update. Human mutation 31: 1269–1279. - PMC - PubMed
    1. Lipton JM, Kudisch M, Gross R, Nathan DG (1986) Defective erythroid progenitor differentiation system in congenital hypoplastic (Diamond-Blackfan) anemia. Blood 67: 962–968. - PubMed
    1. Ohene-Abuakwa Y, Orfali KA, Marius C, Ball SE (2005) Two-phase culture in Diamond Blackfan anemia: localization of erythroid defect. Blood 105: 838–846. - PubMed

Publication types

MeSH terms