

The impact of population demography and selection on the genetic architecture of complex traits
- PMID: 24875776
- PMCID: PMC4038606
- DOI: 10.1371/journal.pgen.1004379
The impact of population demography and selection on the genetic architecture of complex traits
Abstract
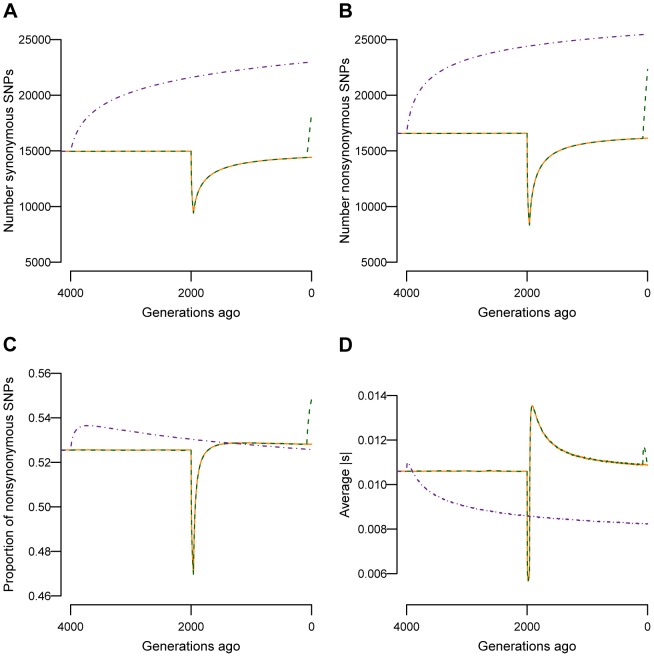
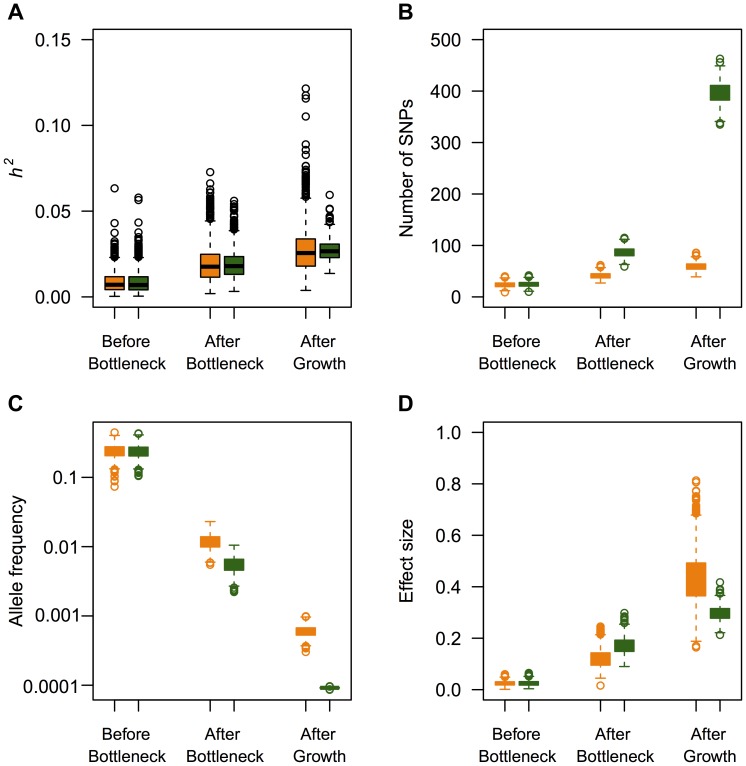
Population genetic studies have found evidence for dramatic population growth in recent human history. It is unclear how this recent population growth, combined with the effects of negative natural selection, has affected patterns of deleterious variation, as well as the number, frequency, and effect sizes of mutations that contribute risk to complex traits. Because researchers are performing exome sequencing studies aimed at uncovering the role of low-frequency variants in the risk of complex traits, this topic is of critical importance. Here I use simulations under population genetic models where a proportion of the heritability of the trait is accounted for by mutations in a subset of the exome. I show that recent population growth increases the proportion of nonsynonymous variants segregating in the population, but does not affect the genetic load relative to a population that did not expand. Under a model where a mutation's effect on a trait is correlated with its effect on fitness, rare variants explain a greater portion of the additive genetic variance of the trait in a population that has recently expanded than in a population that did not recently expand. Further, when using a single-marker test, for a given false-positive rate and sample size, recent population growth decreases the expected number of significant associations with the trait relative to the number detected in a population that did not expand. However, in a model where there is no correlation between a mutation's effect on fitness and the effect on the trait, common variants account for much of the additive genetic variance, regardless of demography. Moreover, here demography does not affect the number of significant associations detected. These findings suggest recent population history may be an important factor influencing the power of association tests and in accounting for the missing heritability of certain complex traits.
Conflict of interest statement
The author has declared that no competing interests exist.
Figures

 and M = 70 kb.
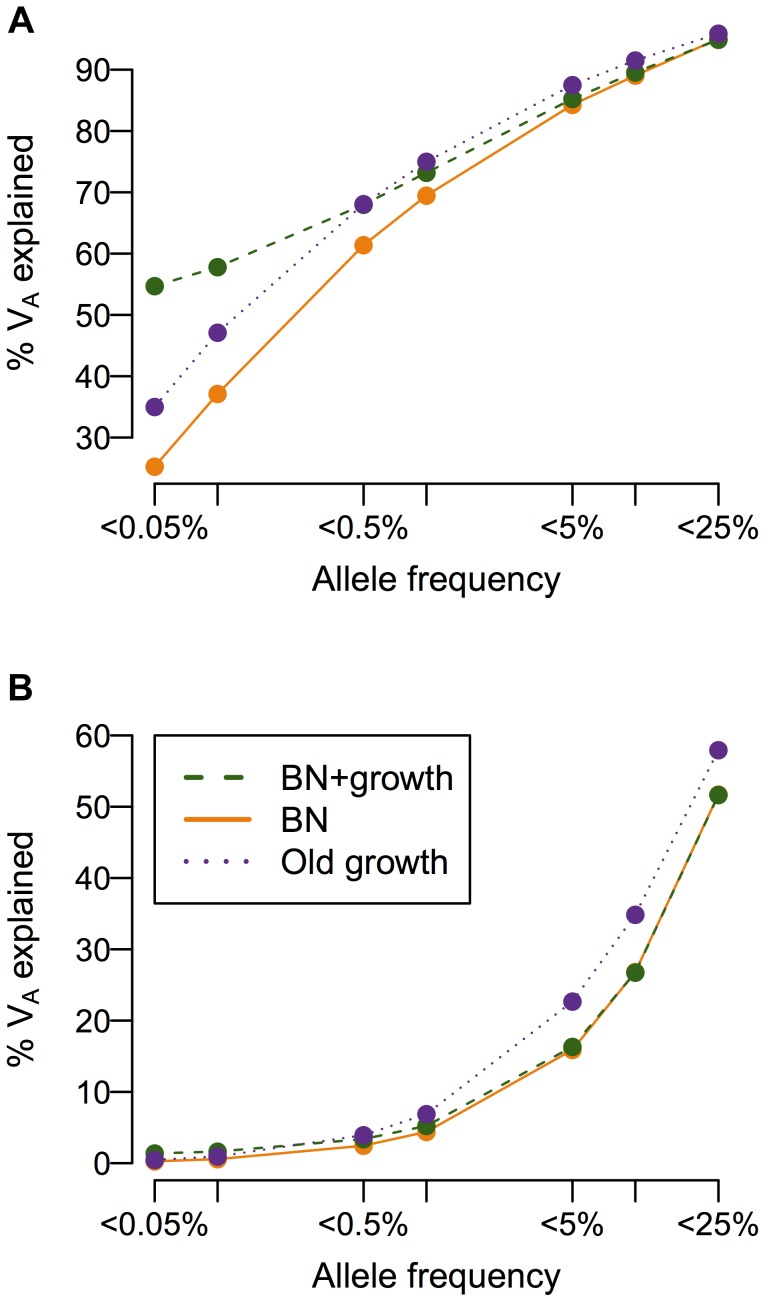
 and M = 70 kb.
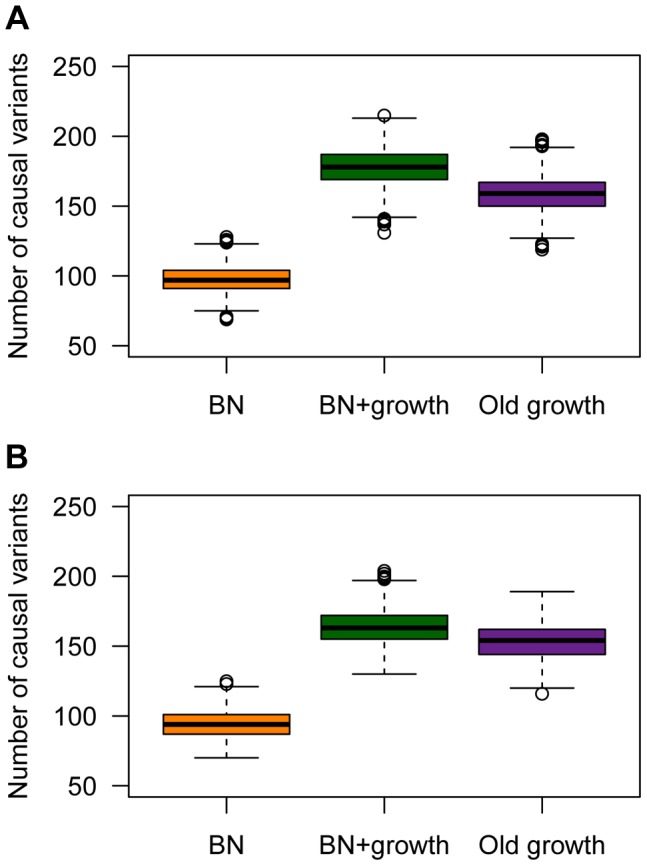
 and M = 70 kb.
 and M = 70 kb.
 and M = 70 kb.
 and M = 70 kb.
References
Publication types
MeSH terms
LinkOut - more resources
Full Text Sources
Other Literature Sources
