. 2014 Aug;4(8):914-27.
doi: 10.1158/2159-8290.CD-14-0363. Epub 2014 May 29.

Autophagy is required for glucose homeostasis and lung tumor maintenance

Affiliations

Autophagy is required for glucose homeostasis and lung tumor maintenance

Gizem Karsli-Uzunbas et al. Cancer Discov. 2014 Aug.

Abstract

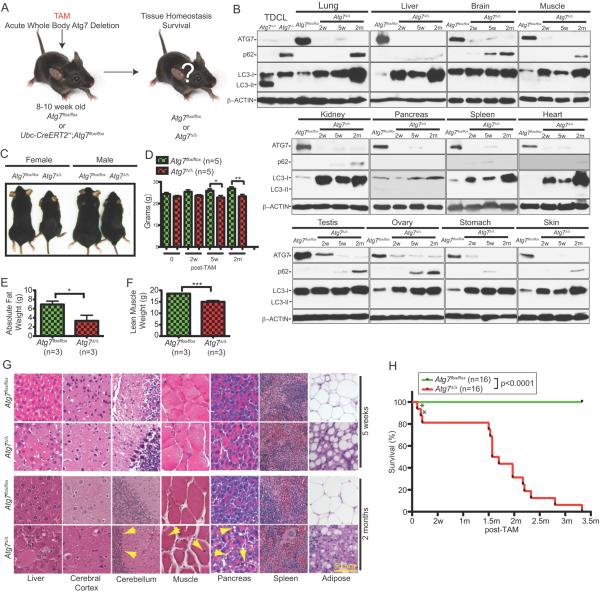
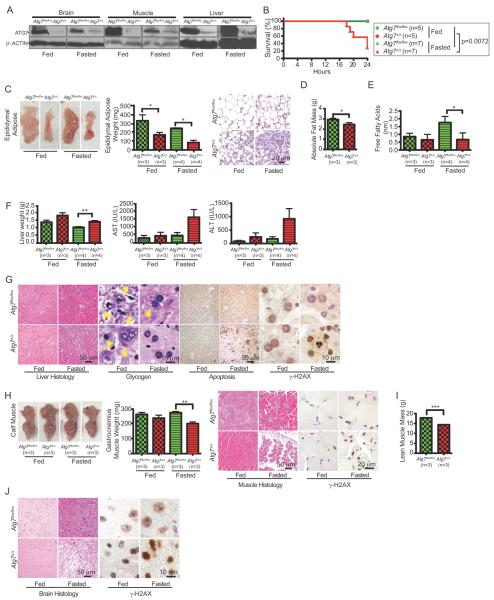
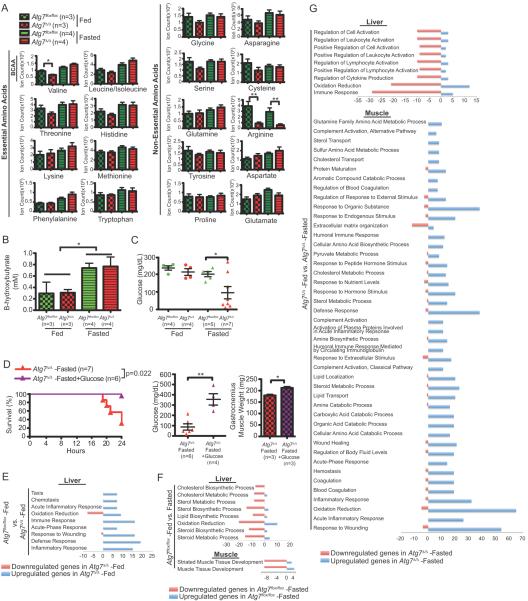
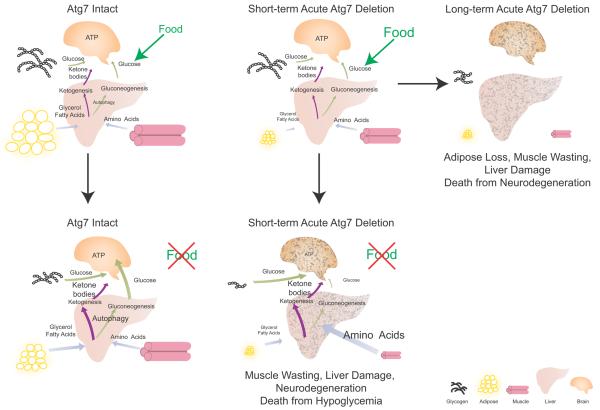
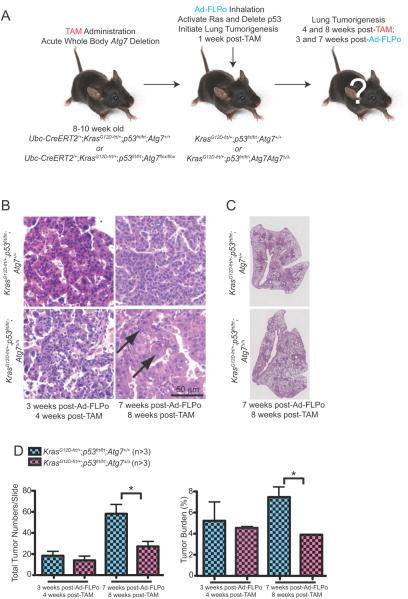
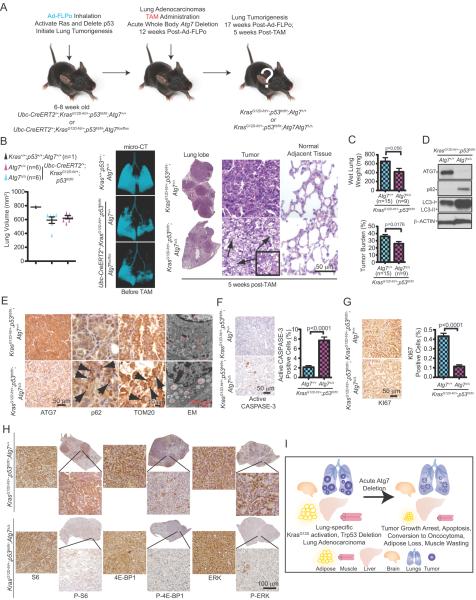
Macroautophagy (autophagy hereafter) recycles intracellular components to sustain mitochondrial metabolism that promotes the growth, stress tolerance, and malignancy of lung cancers, suggesting that autophagy inhibition may have antitumor activity. To assess the functional significance of autophagy in both normal and tumor tissue, we conditionally deleted the essential autophagy gene, autophagy related 7 (Atg7), throughout adult mice. Here, we report that systemic ATG7 ablation caused susceptibility to infection and neurodegeneration that limited survival to 2 to 3 months. Moreover, upon fasting, autophagy-deficient mice suffered fatal hypoglycemia. Prior autophagy ablation did not alter the efficiency of non-small cell lung cancer (NSCLC) initiation by activation of oncogenic Kras(G12D) and deletion of the Trp53 tumor suppressor. Acute autophagy ablation in mice with preexisting NSCLC, however, blocked tumor growth, promoted tumor cell death, and generated more benign disease (oncocytomas). This antitumor activity occurred before destruction of normal tissues, suggesting that acute autophagy inhibition may be therapeutically beneficial in cancer.

Significance: We systemically ablated cellular self-cannibalization by autophagy in adult mice and determined that it is dispensable for short-term survival, but required to prevent fatal hypoglycemia and cachexia during fasting, delineating a new role for autophagy in metabolism. Importantly, acute, systemic autophagy ablation was selectively destructive to established tumors compared with normal tissues, thereby providing the preclinical evidence that strategies to inhibit autophagy may be therapeutically advantageous for RAS-driven cancers.


Figures

Figure 1
Figure 1. Conditional whole-body deletion of Atg7 abrogates autophagy and impairs long-term survival
A. Experimental design for generation of Atg7Δ/Δ mice. Atg7flox/flox or Ubc-CreERT2/+;Atg7flox/flox mice were treated with TAM at 8–10 week of age by intraperitoneal injection and analyzed at times thereafter. B. Western blotting for ATG7, p62 and LC3 at the indicated times (w: weeks, m: months) of the indicated tissues from TAM-treated Atg7flox/flox or AtgΔ/Δ adult mice. Atg7flox/flox control tissues are from a 5 weeks post-TAM-treated mouse. Tumor derived cell lines (TDCL) from Atg7-intact and -deficient tumors (16) were used as controls for ATG7, LC3 and p62 protein expression. β-ACTIN serves a protein loading control. C. Representative pictures of 2 months post-TAM-treated Atg7flox/flox or Atg7Δ/Δ female and male mice (n=3 for each genotype). D. Body weight difference of TAM-treated Atg7flox/flox or Atg7Δ/Δ adult mice at the indicated times (w: weeks, m: months). Error bar represents SEM, *p<0.05, **p<0.01 (two-way ANOVA with Bonferroni post-test). E. Body fat composition as determined by EchoMRI of 10 days post-TAM-treated Atg7flox/flox or Atg7Δ/Δ adult mice. Error bar represents SEM, *p<0.05 ((two-way ANOVA with Bonferroni post-test). F. Lean muscle mass as determined by EchoMRI of 10 days post-TAM-treated Atg7flox/flox or Atg7Δ/Δ adult mice. Error bar represents SEM, ***p<0.001 (two-way ANOVA with Bonferroni post-test). G. Representative liver, cerebral cortex, cerebellum, muscle, pancreas, spleen and adipose histology (Hematoxylin and Eosin stained; H&E) of TAM-treated Atg7flox/flox or Atg7Δ/Δ adult mice at indicated times. Arrowheads in cerebellum point to purkinje cells, arrowheads in muscle point to centrally nucleated myofibers, arrowheads in pancreas point to intra-acinar vacuolization. H. Kaplan-Meier survival curve of TAM-treated Atg7flox/flox or Atg7Δ/Δ adult mice (w: weeks, m: months). Asterisks denote mice that died of infection. p<0.0001 (log-rank Mantel-Cox test).
Figure 2
Figure 2. Autophagy is required for adult mice to survive fasting
A. ATG7 Western blot of tissue lysates from Atg7flox/flox or Atg7Δ/Δ adult mice 10 days post-TAM-treated, fed and fasted. β-ACTIN serves a protein loading control. B. Kaplan-Meier survival curve of Atg7flox/flox or Atg7Δ/Δ adult mice 10 days post-TAM-treated fed and fasted; p=0.0072 (log-rank Mantel-Cox test). C. Representative male pictures (left), tissue weight (middle) and histology (H&E) (right) of epididymal adipose tissues of Atg7flox/flox or Atg7Δ/Δ adult mice 10 days post-TAM-treated fed and fasted (n=4, for each). Error bar represents SEM, *p<0.05 (two-way ANOVA with Bonferroni post-test). D. Body fat composition as determined by EchoMRI of Atg7flox/flox or Atg7Δ/Δ adult mice 10 days post-TAM-treated. Error bar represents SEM, *p<0.05 (two-way ANOVA with Bonferroni post-test). E. Quantification of serum FFA levels of Atg7flox/flox or Atg7Δ/Δ adult mice 10 days post-TAM-treated fed and fasted. Error bar represents SEM, *p<0.05 (two-way ANOVA with Bonferroni post-test). F. Liver weight (left) and serum level of liver enzymes AST (middle) and ALT (right) from Atg7flox/flox or Atg7Δ/Δ adult mice 10 days post-TAM-treated fed and fasted. Error bar represents SEM, **p<0.01 (two-way ANOVA with Bonferroni post-test). G. Representative liver histology (H&E) and liver glycogen levels (PAS staining) of Atg7flox/flox or Atg7Δ/Δ adult mice 10 days post-TAM-treated fed and fasted. Arrowheads point to glycogen. IHC staining for Active Caspase-3 shows apoptosis induction and IHC staining for γ-H2AX shows DNA damage response activation in ATG7-deficient liver tissue when fasted. H. Representative gross image of calf muscle (left) and weight of gastrocnemius muscle and representative muscle histology (H&E) from Atg7flox/flox or Atg7Δ/Δ adult mice 10 days post-TAM-treated fed and fasted. IHC staining for γ-H2AX shows DNA damage response activation in ATG7-deficient muscle tissue when fasted. Error bar represents SEM, **p<0.01 (two-way ANOVA with Bonferroni post-test). I. Lean muscle mass as determined by EchoMRI of Atg7flox/flox or Atg7Δ/Δ adult mice 10 days post-TAM-treated. Error bar represents SEM, ***p<0.001 (two-way ANOVA with Bonferroni post-test). J. Representative brain histology (H&E) of Atg7flox/flox or Atg7Δ/Δ adult mice 10 days post-TAM-treated fed and fasted. IHC staining for γ-H2AX shows DNA damage response activation in ATG7-deficient brain tissue when fasted.
Figure 3
Figure 3. Autophagy sustains glucose homeostasis required to survive fasting
A. Quantification of serum amino acid levels in Atg7flox/flox or Atg7Δ/Δ adult mice 10 days post-TAM-treated fed and fasted. BCAA: branched chain amino acid. Error bar represents SEM, *p<0.05, **p<0.01 (two-way ANOVA with Bonferroni post-test). B. Quantification of serum β-hydroxybutyrate levels in Atg7flox/flox or Atg7Δ/Δ adult mice 10 days post-TAM-treated fed and fasted. Error bar represents SEM, *p<0.05 (two-way ANOVA with Bonferroni post-test). C. Quantification of blood glucose levels of Atg7flox/flox or Atg7Δ/Δ adult mice 10 days post-TAM-treated fed and fasted. Error bar represents SEM, *p<0.05 (two-way ANOVA with Bonferroni post-test). D. Kaplan-Meier survival curve (left), serum glucose levels (middle) and weight of gastrocnemius muscle (right) from Atg7Δ/Δ adult mice 10 days post-TAM-treated, fasted, without or with glucose supplemented p=0.0022 (log-rank Mantel-Cox test). Error bar represents SEM, *p<0.05, **p<0.01 (two-way ANOVA with Bonferroni post-test). E–G. Analysis of differentially expressed genes from liver and muscle tissue in Atg7flox/flox or Atg7Δ/Δ adult mice 10 days post-TAM-treated, fed and fasted showing upregulated (blue) or downregulated (pink) genes for significant biological processes as determined by GO term DAVID Analysis. Number scale represents the number of up- (positive number) and down- (negative number) regulated genes in the indicated biological processes.
Figure 4
Figure 4. Mechanism by which autophagy supports survival of adult mice during fasting
See text for explanation.
Figure 5
Figure 5. Acute, systemic autophagy ablation does not alter the efficiency of tumor initiation
A. Experimental design to induce conditional whole-body Atg7 deletion prior to tumor induction. Ubc-CreERT2/+;KrasG12D-frt/+;p53frt/frt;Atg7+/+ and Ubc-CreERT2/+;KrasG12D-frt/+;p53frt/frt;Atg7flox/flox mice were treated with TAM at 8–10 weeks of age by intraperitoneal injection to delete Atg7 throughout the mouse, then these mice were infected with Ad-FLPo at 1 week post-TAM to activate RAS and delete p53 and were analyzed at times thereafter. B. Representative lung tumor histology (H&E) at 3 weeks post-Ad-FLPo, 4 weeks post-TAM (left) and 7 weeks post-Ad-FLPo, 8 weeks post-TAM (right). Arrows point to oncocytes. C. Representative lung lobes at 7 weeks post-Ad-FLPo and 8 weeks post-TAM in the indicated genotypes. D. Quantification of tumor numbers (left) and tumor burden (right) at the indicated times. Error bar represents SEM, *p<0.05 (two-way ANOVA with Bonferroni post-test).
Figure 6
Figure 6. Acute, systemic Atg7 deficiency compromises tumorigenesis
A. Experimental design to induce lung tumors prior to conditional whole-body Atg7 deletion. Ubc-CreERT2/+;KrasG12D-frt/+;p53frt/frt;Atg7+/+ and Ubc-CreERT2/+;KrasG12D-frt/+;p53frt/frt;Atg7flox/flox mice were infected with Ad-FLPo at 6–8 weeks of age to activate RAS and delete p53, then these mice were treated with TAM at 12 weeks post-Ad-FLPo by intraperitoneal injection to create Atg7Δ/Δ mice. Tumor progression was analyzed at various times thereafter. B. Representative micro-CT 3-dimensional reconstruction and quantification of lung volume showing healthy air space before TAM treatment and equivalent tumor burden at the time of TAM treatment of mice with the indicated genotypes. Kras+/+;p53+/+;Atg7+/+ mice were used as a control for normal lung airspace. Tumor histology and normal adjacent lung tissue (H&E images) were analyzed at 5 weeks post-TAM (last three panels). Arrows point to dead cells. C. Quantification of wet lung weight (top) and tumor burden (bottom). Error bar represents SEM, p values are calculated using two-way ANOVA with Bonferroni post-test. D. Representative western blotting for ATG7, p62, S6, P-S6 and LC3 of Atg7+/+ or AtgΔ/Δ tumor tissues. β-ACTIN serves a protein loading control. E. Representative IHC for ATG7, p62, TOM20 and EM images of tumor tissue. Arrows in second panel point to p62 aggregates and arrows in the third panel point to TOM20 accumulation in tumors from ATG7-deficient mice. N: nucleus, M: mitochondria, Ly: Lysosome, AP: Autophagosome, L: Lipid. F. Representative IHC images for active CASPASE-3 (left) with quantification (right). Error bar represents SEM, p values are calculated using two-way ANOVA with Bonferroni post-test. G. Representative IHC images for KI67 (left) with quantification (right). Error bar represents SEM, p values are calculated using two-way ANOVA with Bonferroni post-test. H. Representative IHC images for S6, P-S6, 4E-BP1, P-4E-BP1, ERK and P-ERK. I. A model for destructive effect of autophagy on established tumors.

Comment in

References

    1. Mizushima N, Komatsu M. Autophagy: renovation of cells and tissues. Cell. 2011;147:728–41. - PubMed
    1. Komatsu M, Waguri S, Ueno T, Iwata J, Murata S, Tanida I, et al. Impairment of starvation-induced and constitutive autophagy in Atg7-deficient mice. J Cell Biol. 2005;169:425–34. - PMC - PubMed
    1. Kuma A, Hatano M, Matsui M, Yamamoto A, Nakaya H, Yoshimori T, et al. The role of autophagy during the early neonatal starvation period. Nature. 2004;432:1032–6. - PubMed
    1. Mizushima N, Yamamoto A, Matsui M, Yoshimori T, Ohsumi Y. In vivo analysis of autophagy in response to nutrient starvation using transgenic mice expressing a fluorescent autophagosome marker. Mol Biol Cell. 2004;15:1101–11. - PMC - PubMed
    1. Hara T, Nakamura K, Matsui M, Yamamoto A, Nakahara Y, Suzuki-Migishima R, et al. Suppression of basal autophagy in neural cells causes neurodegenerative disease in mice. Nature. 2006;441:885–9. - PubMed

Publication types

MeSH terms