

Dynamics of HIV latency and reactivation in a primary CD4+ T cell model
- PMID: 24875931
- PMCID: PMC4038609
- DOI: 10.1371/journal.ppat.1004156
Dynamics of HIV latency and reactivation in a primary CD4+ T cell model
Abstract
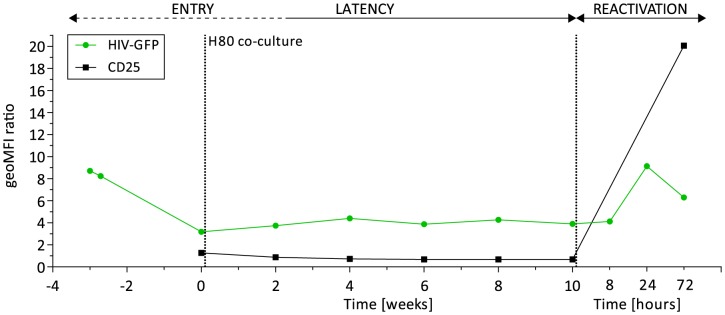
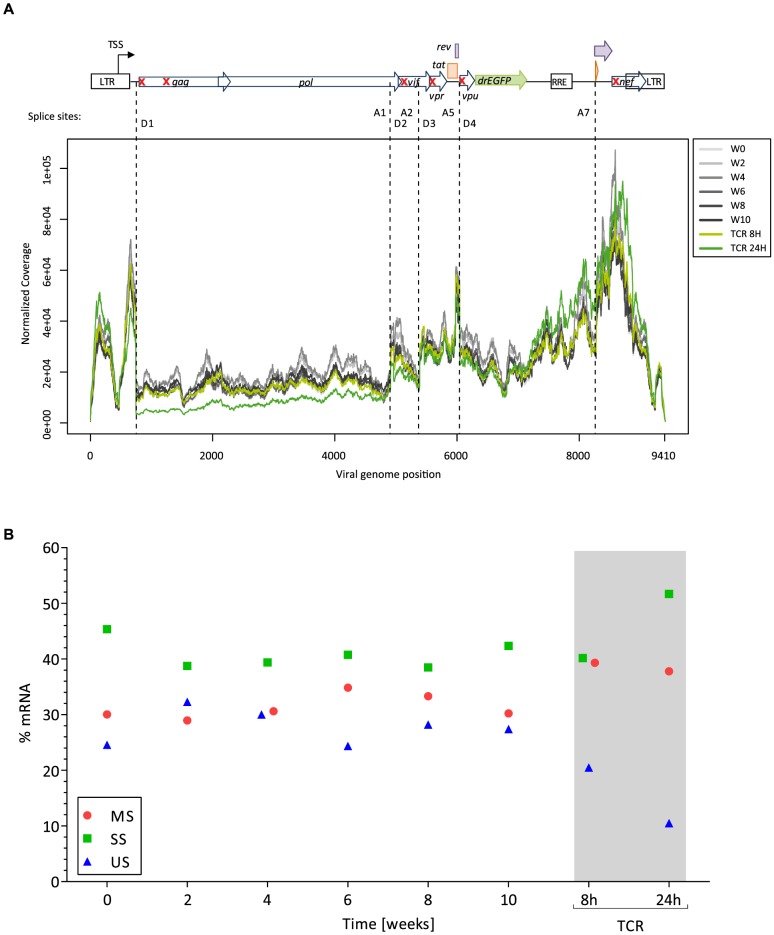
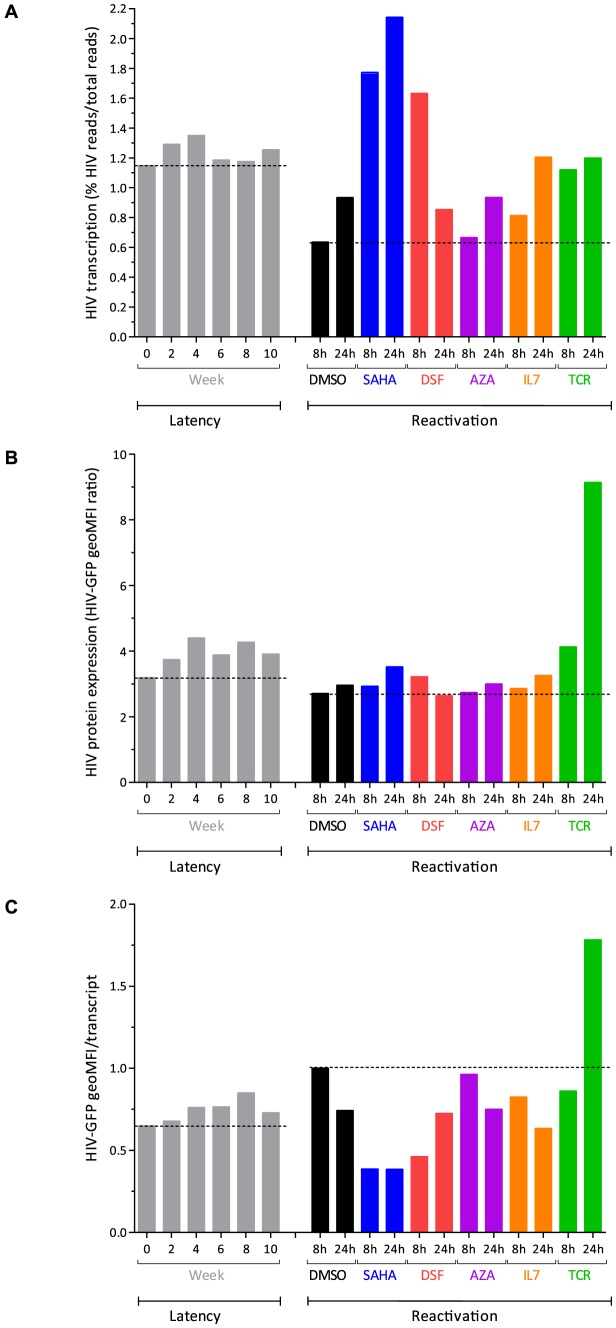
HIV latency is a major obstacle to curing infection. Current strategies to eradicate HIV aim at increasing transcription of the latent provirus. In the present study we observed that latently infected CD4+ T cells from HIV-infected individuals failed to produce viral particles upon ex vivo exposure to SAHA (vorinostat), despite effective inhibition of histone deacetylases. To identify steps that were not susceptible to the action of SAHA or other latency reverting agents, we used a primary CD4+ T cell model, joint host and viral RNA sequencing, and a viral-encoded reporter. This model served to investigate the characteristics of latently infected cells, the dynamics of HIV latency, and the process of reactivation induced by various stimuli. During latency, we observed persistence of viral transcripts but only limited viral translation. Similarly, the reactivating agents SAHA and disulfiram successfully increased viral transcription, but failed to effectively enhance viral translation, mirroring the ex vivo data. This study highlights the importance of post-transcriptional blocks as one mechanism leading to HIV latency that needs to be relieved in order to purge the viral reservoir.
Conflict of interest statement
The authors have declared that no competing interests exist.
Figures

Similar articles
-
Posttranscriptional Regulation of HIV-1 Gene Expression during Replication and Reactivation from Latency by Nuclear Matrix Protein MATR3.mBio. 2018 Nov 13;9(6):e02158-18. doi: 10.1128/mBio.02158-18. mBio. 2018. PMID: 30425153 Free PMC article.
-
A flexible model of HIV-1 latency permitting evaluation of many primary CD4 T-cell reservoirs.PLoS One. 2012;7(1):e30176. doi: 10.1371/journal.pone.0030176. Epub 2012 Jan 24. PLoS One. 2012. PMID: 22291913 Free PMC article.
-
The histone deacetylase inhibitor vorinostat (SAHA) increases the susceptibility of uninfected CD4+ T cells to HIV by increasing the kinetics and efficiency of postentry viral events.J Virol. 2014 Sep;88(18):10803-12. doi: 10.1128/JVI.00320-14. Epub 2014 Jul 9. J Virol. 2014. PMID: 25008921 Free PMC article.
-
Reservoirs for HIV-1: mechanisms for viral persistence in the presence of antiviral immune responses and antiretroviral therapy.Annu Rev Immunol. 2000;18:665-708. doi: 10.1146/annurev.immunol.18.1.665. Annu Rev Immunol. 2000. PMID: 10837072 Review.
-
Experimental approaches to the study of HIV-1 latency.Nat Rev Microbiol. 2007 Feb;5(2):95-106. doi: 10.1038/nrmicro1580. Nat Rev Microbiol. 2007. PMID: 17224919 Review.
Cited by
-
Gut and blood differ in constitutive blocks to HIV transcription, suggesting tissue-specific differences in the mechanisms that govern HIV latency.PLoS Pathog. 2018 Nov 15;14(11):e1007357. doi: 10.1371/journal.ppat.1007357. eCollection 2018 Nov. PLoS Pathog. 2018. PMID: 30440043 Free PMC article.
-
Entry of Polarized Effector Cells into Quiescence Forces HIV Latency.mBio. 2019 Mar 26;10(2):e00337-19. doi: 10.1128/mBio.00337-19. mBio. 2019. PMID: 30914509 Free PMC article.
-
Transcriptomic Analysis Implicates the p53 Signaling Pathway in the Establishment of HIV-1 Latency in Central Memory CD4 T Cells in an In Vitro Model.PLoS Pathog. 2016 Nov 29;12(11):e1006026. doi: 10.1371/journal.ppat.1006026. eCollection 2016 Nov. PLoS Pathog. 2016. PMID: 27898737 Free PMC article.
-
Nuclear retention of unspliced HIV-1 RNA as a reversible post-transcriptional block in latency.Nat Commun. 2025 Feb 28;16(1):2078. doi: 10.1038/s41467-025-57290-y. Nat Commun. 2025. PMID: 40021667 Free PMC article.
-
A Natural Product from Polygonum cuspidatum Sieb. Et Zucc. Promotes Tat-Dependent HIV Latency Reversal through Triggering P-TEFb's Release from 7SK snRNP.PLoS One. 2015 Nov 16;10(11):e0142739. doi: 10.1371/journal.pone.0142739. eCollection 2015. PLoS One. 2015. PMID: 26569506 Free PMC article.
References
-
- Deeks SG (2012) HIV: Shock and kill. Nature 487: 439–440. - PubMed
MeSH terms
Substances
LinkOut - more resources
Full Text Sources
Other Literature Sources
Medical
Research Materials
