

Molecular imaging with bioluminescence and PET reveals viral oncolysis kinetics and tumor viability
- PMID: 24876106
- PMCID: PMC4147034
- DOI: 10.1158/0008-5472.CAN-13-3472
Molecular imaging with bioluminescence and PET reveals viral oncolysis kinetics and tumor viability
Abstract
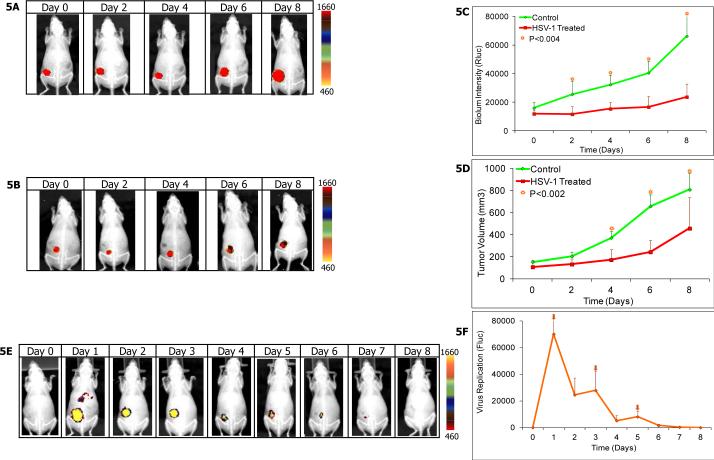
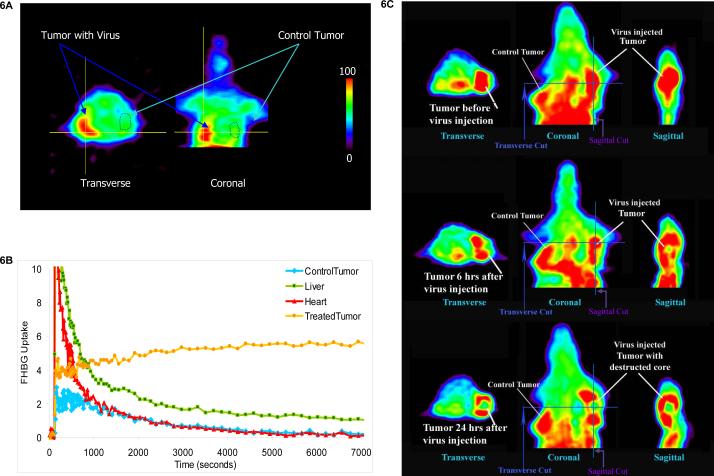
Viral oncolysis, the destruction of cancer cells by replicating virus, is an experimental cancer therapy that continues to be explored. The treatment paradigm for this therapy involves successive waves of lytic replication in cancer cells. At present, monitoring viral titer at sites of replication requires biopsy. However, repeat serial biopsies are not practically feasible for temporal monitoring of viral replication and tumor response in patients. Molecular imaging provides a noninvasive method to identify intracellular viral gene expression in real time. We imaged viral oncolysis and tumor response to oncolysis sequentially with bioluminescence and positron emission tomography (PET), revealing the kinetics of both processes in tumor xenografts. We demonstrate that virus replication cycles can be identified as successive waves of reporter expression that occur ∼2 days after the initial viral tumor infection peak. These waves correspond to virions that are released following a replication cycle. The viral and cellular kinetics were imaged with Fluc and Rluc bioluminescence reporters plus two 18F-labeled PET reporters FHBG [9-(4-18F-fluoro-3-[hydroxymethyl] butyl) guanine] and FLT (18F-3'-deoxy-3-'fluorothymidine), respectively. Correlative immunohistochemistry on tumor xenograft sections confirmed in vivo results. Our findings show how PET can be used to identify virus replication cycles and for real-time measurements of intratumoral replicating virus levels. This noninvasive imaging approach has potential utility for monitoring viral oncolysis therapy in patients.
©2014 American Association for Cancer Research.
Figures


Similar articles
-
Positron emission tomography of herpes simplex virus 1 oncolysis.Cancer Res. 2007 Apr 1;67(7):3295-300. doi: 10.1158/0008-5472.CAN-06-4062. Cancer Res. 2007. PMID: 17409438
-
Quantifying the activity of adenoviral E1A CR2 deletion mutants using renilla luciferase bioluminescence and 3'-deoxy-3'-[18F]fluorothymidine positron emission tomography imaging.Cancer Res. 2006 Sep 15;66(18):9178-85. doi: 10.1158/0008-5472.CAN-06-1539. Cancer Res. 2006. PMID: 16982761
-
Noninvasive monitoring of mRFP1- and mCherry-labeled oncolytic adenoviruses in an orthotopic breast cancer model by spectral imaging.Mol Imaging. 2010 Apr;9(2):59-75. Mol Imaging. 2010. PMID: 20236604 Free PMC article.
-
HSV-1 viral oncolysis and molecular imaging with PET.Curr Cancer Drug Targets. 2007 Mar;7(2):175-80. doi: 10.2174/156800907780058871. Curr Cancer Drug Targets. 2007. PMID: 17346109 Review.
-
Quantitative imaging and dynamics of tumor therapy with viruses.FEBS J. 2021 Nov;288(21):6273-6285. doi: 10.1111/febs.16102. Epub 2021 Aug 29. FEBS J. 2021. PMID: 34213827 Review.
Cited by
-
Chemiluminescence and Bioluminescence Imaging for Biosensing and Therapy: In Vitro and In Vivo Perspectives.Theranostics. 2019 May 31;9(14):4047-4065. doi: 10.7150/thno.33228. eCollection 2019. Theranostics. 2019. PMID: 31281531 Free PMC article. Review.
-
A bright future for bioluminescent imaging in viral research.Future Virol. 2015;10(2):169-183. doi: 10.2217/fvl.14.96. Future Virol. 2015. PMID: 26413138 Free PMC article.
-
HSV-1 as a novel therapy for breast cancer meningeal metastases.Cancer Gene Ther. 2015 Oct;22(10):506-8. doi: 10.1038/cgt.2015.43. Epub 2015 Sep 18. Cancer Gene Ther. 2015. PMID: 26384139 Free PMC article.
-
Evolving Role of Oncolytic Virotherapy: Challenges and Prospects in Clinical Practice.JCO Precis Oncol. 2021 Feb 24;5:PO.20.00395. doi: 10.1200/PO.20.00395. eCollection 2021. JCO Precis Oncol. 2021. PMID: 34250386 Free PMC article. Review.
-
Oncolytic HSV1 targets different growth phases of breast cancer leptomeningeal metastases.Cancer Gene Ther. 2023 Jun;30(6):833-844. doi: 10.1038/s41417-023-00588-0. Epub 2023 Feb 1. Cancer Gene Ther. 2023. PMID: 36721067
References
Publication types
MeSH terms
Grants and funding
- R21 CA186054/CA/NCI NIH HHS/United States
- 1R01EB012864/EB/NIBIB NIH HHS/United States
- S10 RR023452/RR/NCRR NIH HHS/United States
- R21 CA119600/CA/NCI NIH HHS/United States
- 5R21CA119600/CA/NCI NIH HHS/United States
- P50 CA127003/CA/NCI NIH HHS/United States
- R01 EB001850/EB/NIBIB NIH HHS/United States
- U01 CA084301/CA/NCI NIH HHS/United States
- 5R01CA076183/CA/NCI NIH HHS/United States
- 1S10RR023452/RR/NCRR NIH HHS/United States
- R01 CA076183/CA/NCI NIH HHS/United States
- U01CA084301/CA/NCI NIH HHS/United States
- P50CA127003/CA/NCI NIH HHS/United States
- R01 EB012864/EB/NIBIB NIH HHS/United States
- 5R01 EB001850/EB/NIBIB NIH HHS/United States
LinkOut - more resources
Full Text Sources
Other Literature Sources
Molecular Biology Databases
