. 2014 Nov;25(11):2526-38.
doi: 10.1681/ASN.2013080901. Epub 2014 May 29.

Endogenous fructose production and fructokinase activation mediate renal injury in diabetic nephropathy

Affiliations

Endogenous fructose production and fructokinase activation mediate renal injury in diabetic nephropathy

Miguel A Lanaspa et al. J Am Soc Nephrol. 2014 Nov.

Abstract

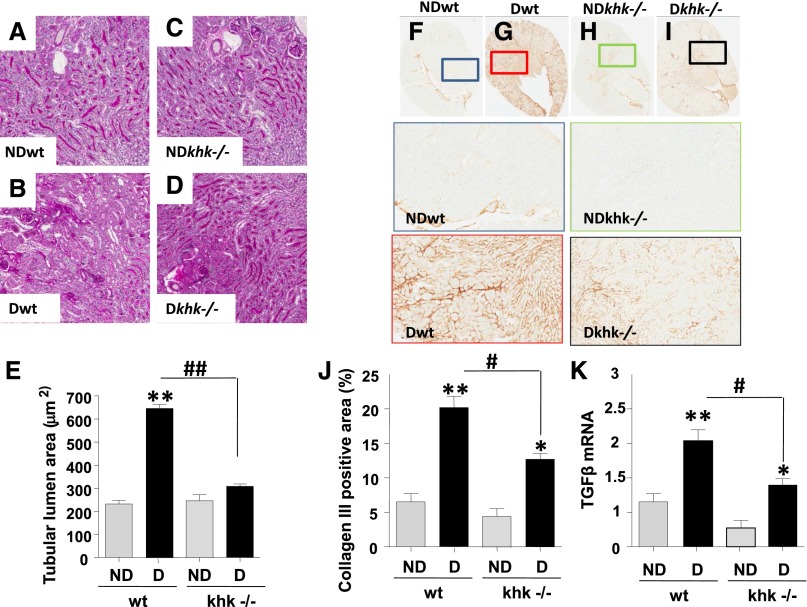
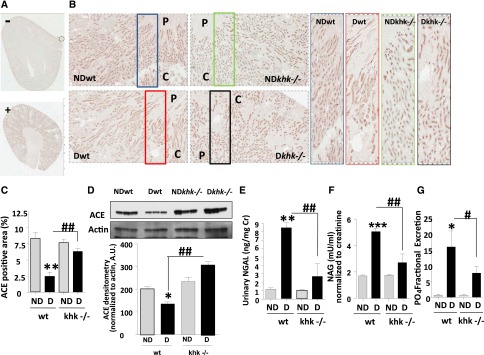
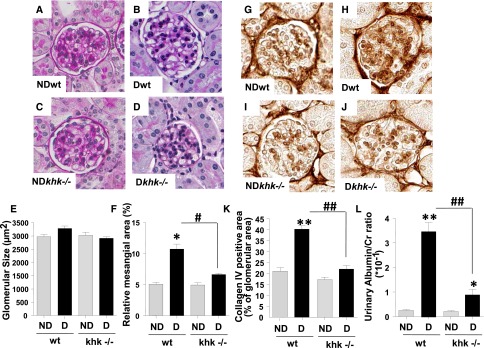
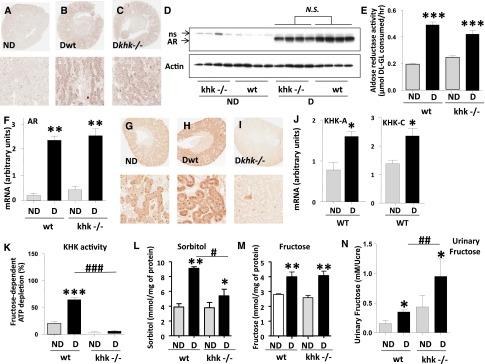
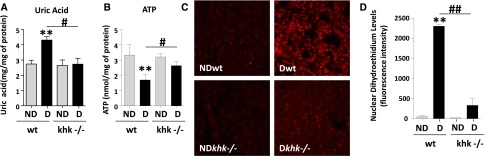
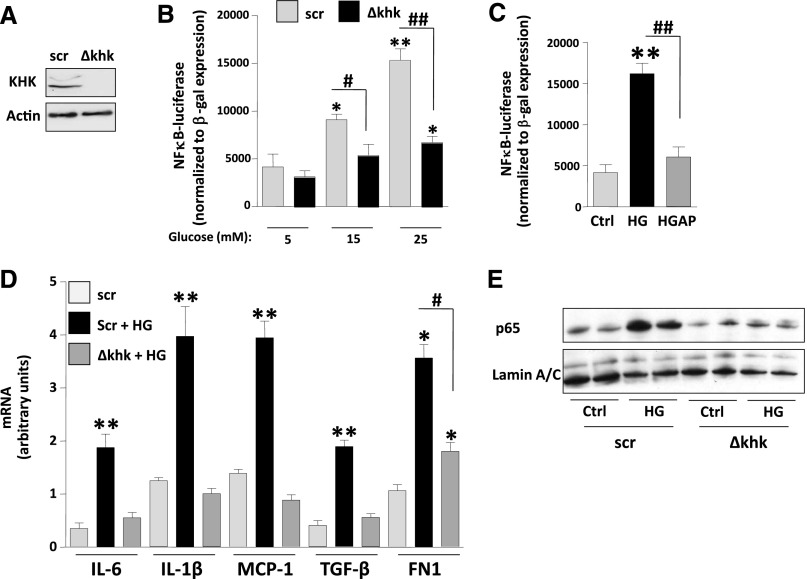
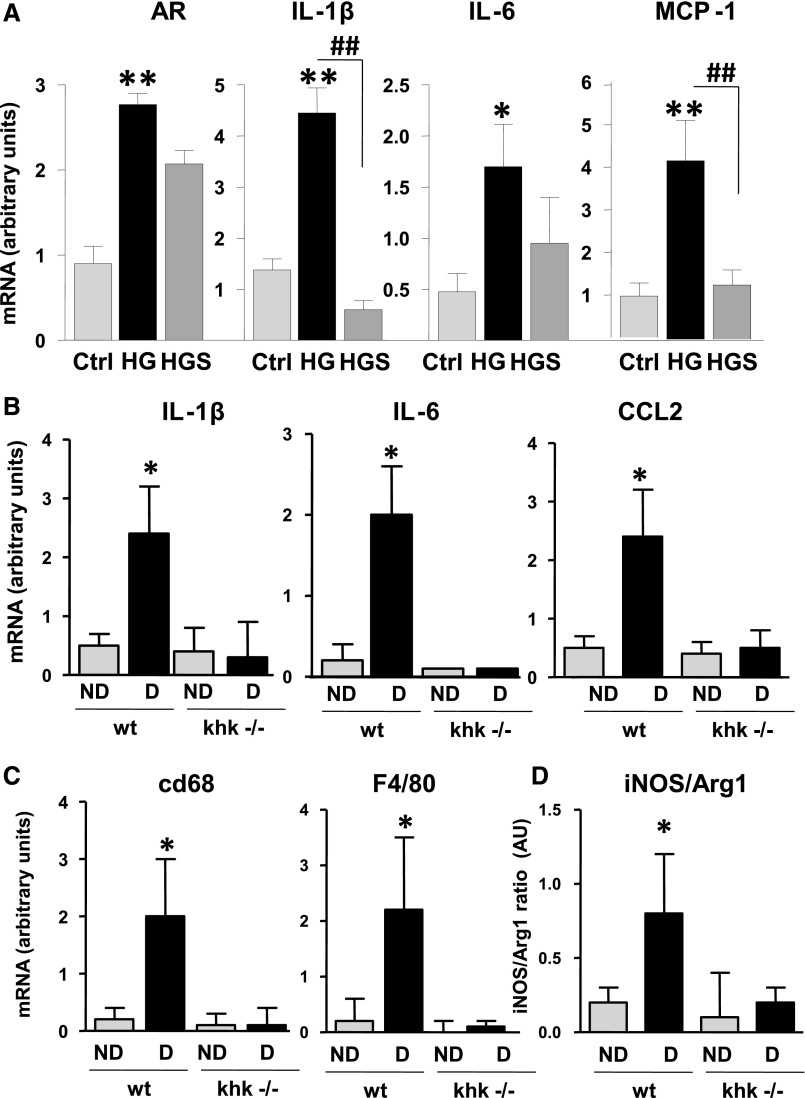
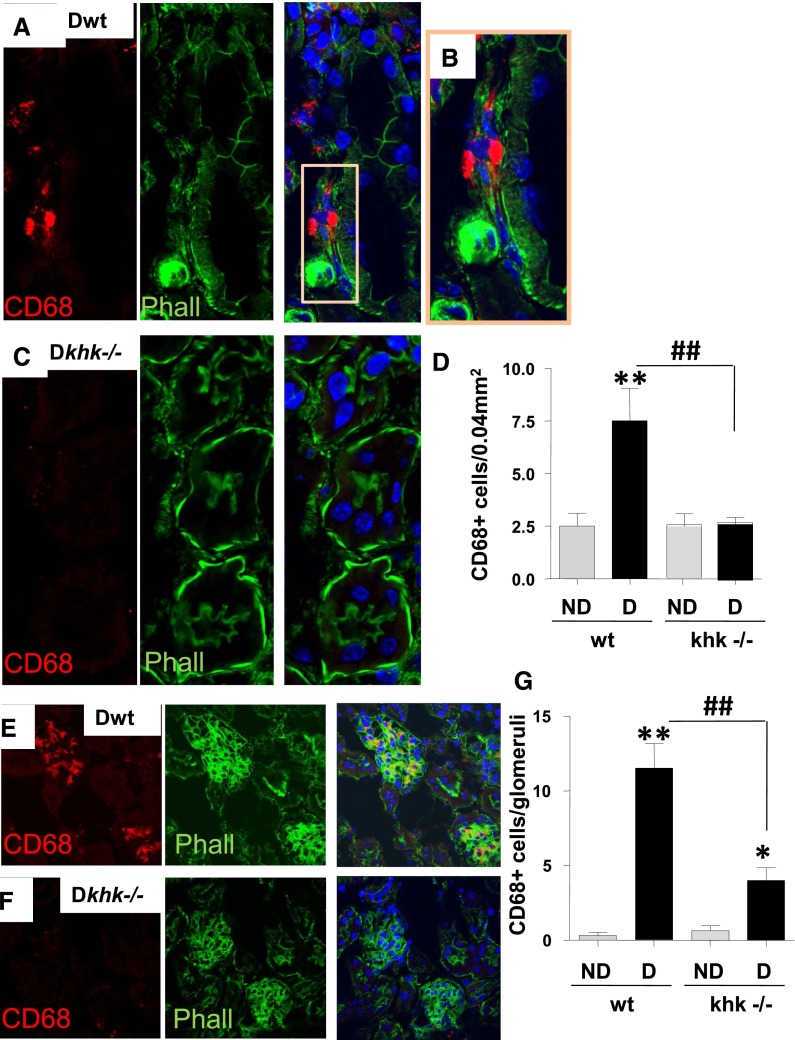
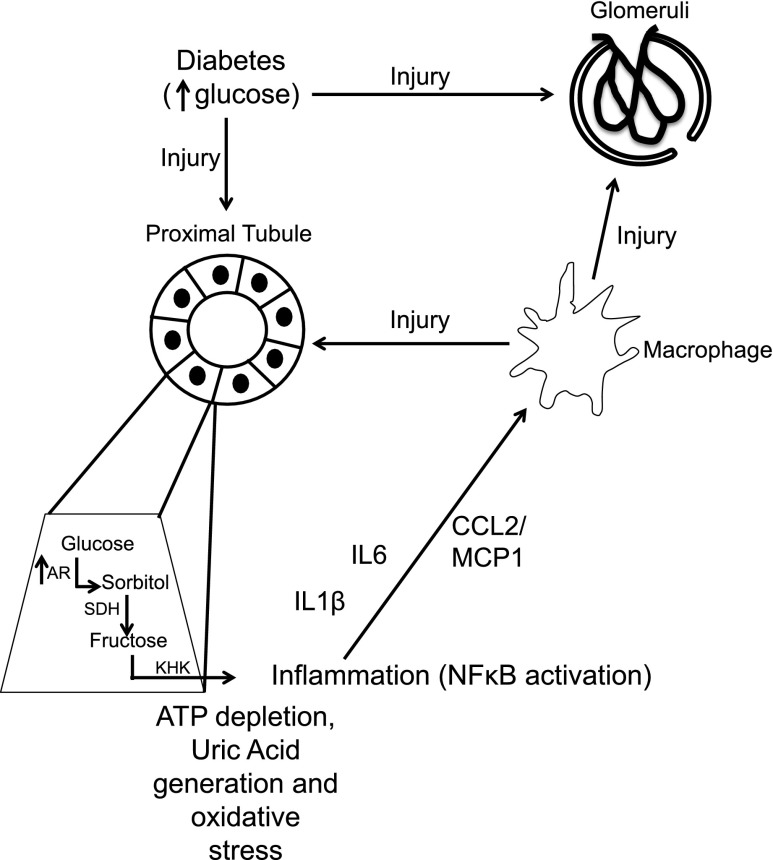
Diabetes is associated with activation of the polyol pathway, in which glucose is converted to sorbitol by aldose reductase. Previous studies focused on the role of sorbitol in mediating diabetic complications. However, in the proximal tubule, sorbitol can be converted to fructose, which is then metabolized largely by fructokinase, also known as ketohexokinase, leading to ATP depletion, proinflammatory cytokine expression, and oxidative stress. We and others recently identified a potential deleterious role of dietary fructose in the generation of tubulointerstitial injury and the acceleration of CKD. In this study, we investigated the potential role of endogenous fructose production, as opposed to dietary fructose, and its metabolism through fructokinase in the development of diabetic nephropathy. Wild-type mice with streptozotocin-induced diabetes developed proteinuria, reduced GFR, and renal glomerular and proximal tubular injury. Increased renal expression of aldose reductase; elevated levels of renal sorbitol, fructose, and uric acid; and low levels of ATP confirmed activation of the fructokinase pathway. Furthermore, renal expression of inflammatory cytokines with macrophage infiltration was prominent. In contrast, diabetic fructokinase-deficient mice demonstrated significantly less proteinuria, renal dysfunction, renal injury, and inflammation. These studies identify fructokinase as a novel mediator of diabetic nephropathy and document a novel role for endogenous fructose production, or fructoneogenesis, in driving renal disease.


Figures

Figure 1.
Figure 1.
Reduced tubular injury in diabetic khk−/− mice compared to wild-type siblings. (A–D) Representative kidney sections stained with PAS in nondiabetic and diabetic wild-type mice and khk−/− mice. Tubular area is shown. No significant tubular dilatation was observed in nondiabetic wild-type (A), khk−/− (C), or diabetic khk−/− (D) mice compared with diabetic wild-type mice (B). Original magnification, ×20 in A–D. (E) Quantification of lumen area in all groups. (F–I) Representative kidney sections stained for collagen III in nondiabetic and diabetic wild-type and khk−/− (H and I) mice. Tubular area is shown. (J) Quantification of collagen III–positive area in all groups. (K) Quantification of TGF-β mRNA levels in kidney cortex of all groups. (n=6). D, diabetic wild-type; ND, nondiabetic wild-type. Mean±SEM. *P<0.05 and **P<0.01 versus respective nondiabetic control; #P<0.05; ##P<0.01.
Figure 2.
Figure 2.
Improved tubular function in diabetic khk−/− mice compared to wild-type siblings. (A and B) Representative kidney sections stained for ACE in nondiabetic and diabetic wild-type mice and khk−/− mice. Tubular area is shown. C, cortex; P, papilla. (A) Negatively and positively staining controls. Original magnification, ×2 in A; ×20 in B. (C) Quantification of ACE-positive area in all groups. (D) Representative Western blot for ACE from kidney cortex homogenates showing significantly lower ACE levels in diabetic wild-type mice compared with nondiabetic mice and diabetic khk−/− mice. (E) Quantification of urinary NGAL—corrected for creatinine levels—in all groups. (F) Quantification of urinary NAG—corrected for creatinine levels—in all groups. (G) Quantification of fractional excretion of phosphate in all groups. (n=6). D, diabetic wild-type; ND, nondiabetic wild-type. Mean±SEM. *P<0.05, **P<0.01, ***P<0.001 versus respective nondiabetic control; #P<0.05, ##P<0.01, and ###P<0.001.
Figure 3.
Figure 3.
Improved glomerular function and injury in diabetic khk−/− mice compared to wild-type siblings. (A–D) Representative kidney sections stained with PAS in nondiabetic and diabetic wild-type mice and khk−/− mice. Glomerular area is shown. No significant glomerular hypertrophy was observed in any group. Original magnification, ×40 in A–D and G–J. (E) Quantification of glomerular area in all groups. (F) Quantification of mesangial area expansion in all groups. (G–J) Representative kidney sections stained for collagen IV in nondiabetic and diabetic wild-type and khk−/− mice. (K) Quantification of collagen IV–positive area in all groups. (L) Quantification of urinary albumin in all groups. (n=6). D, diabetic wild-type; ND, nondiabetic wild-type. Mean±SEM. *P<0.05 and **P<0.01 versus respective nondiabetic control; #P<0.05 and ##P<0.01.
Figure 4.
Figure 4.
Aldose reductase and the polyol pathway are activated in the kidney cortex of diabetic mice. (A–C) Representative kidney sections stained for AR in nondiabetic and diabetic wild-type mice and khk−/− mice. Whole kidney (top) and tubular area (bottom) is shown. Original magnification, ×2 in A–C and G, top images; ×20 A–C and G, bottom images. (D) Representative Western blot for AR from kidney cortex homogenates demonstrating significantly increased expression in diabetic mice compared with nondiabetic animals. NS, nonspecific band. (E) Quantification of AR activity in kidney cortex homogenates in all groups. (F) Quantification of kidney cortex AR mRNA expression in all groups. (G–I) Representative kidney sections stained for KHK in nondiabetic and diabetic wild-type mice and khk−/− mice. Whole kidney (top) and tubular area (bottom) are shown. (J) Quantification of isoforms A and C of KHK in kidney cortex of all groups. (K) Quantification of kidney cortex KHK activity in all groups. (L) Quantification of renal cortical sorbitol levels in all groups. (M) Quantification of renal cortical fructose in all groups. (N) Quantification of urinary fructose levels—normalized to urinary creatinine—in all groups. (n=6). D, diabetic wild-type; ND, nondiabetic wild-type. Mean±SEM. *P<0.05, **P<0.01, and ***P<0.001 versus respective nondiabetic control; #P<0.05, ##P<0.01, and ###P<0.001.
Figure 5.
Figure 5.
Reduced renal uric acid and oxidative stress in diabetic khk−/− mice compared to wild-type siblings. (A) Quantification of renal cortex uric acid levels in all groups. (B) Quantification of renal cortex ATP levels in all groups. (C) Representative images of DHE staining demonstrating increased nuclear staining in diabetic wild-type mice compared with the rest of the groups. Original magnification, ×20. (D) Fluorescence intensity quantification of DHE in all groups. D, diabetic wild-type; ND, nondiabetic wild-type. Mean±SEM. **P<0.01 versus respective nondiabetic control; #P<0.05 and ##P<0.01.
Figure 6.
Figure 6.
Fructose metabolism blockade is associated with reduced inflammation in proximal tubular cells exposed to high glucose levels. (A) Representative Western blot of HK-2 cells control (Scr [scramble]) and stably silenced for KHK expression (Δkhk). (B) Luciferase units—normalized to β-gal expression—in scr and Δkhk cells transfected with an NF-κB-luciferase reporter cassette and exposed to increasing levels of glucose. (C) Luciferase units—normalized to β-gal expression—in regular HK-2 cells transfected with an NF-κB-luciferase reporter cassette and exposed to high glucose (HG; 25 mM) in the presence or absence of allopurinol (100 µM). (D) Quantification of mRNA levels of cytokines (IL-1β and IL-6), chemokines (MCP-1), and fibrotic genes (TGFβ and FN1) in scr and Δkhk HK-2 cells exposed to high glucose levels (25 mM). (E) Representative Western blot of p65 from nuclear extracts from scr and Δkhk cells under control (ctrl) or high glucose conditions. Mean±SEM. *P<0.05 and **P<0.01 versus respective control; #P<0.05 and ##P<0.01.
Figure 7.
Figure 7.
Reduced inflammatory markers in the proximal tubule after blockade of aldose reducatse and fructokinase. (A) mRNA expression of AR, cytokines (IL-1β and IL-6), and the chemokine MCP-1 in HK-2 cells control (ctrl), and exposed to 25 mM high glucose (HG) alone or in the presence of the AR inhibitor sorbinil (HGS; 10 µM). *P<0.05 and **P<0.01 versus control; ##P<0.01. (B) Quantification of mRNA levels of IL-1β, IL-6, and CCL2 in kidney cortex of diabetic wild-type and khk−/− mice. (C) Quantification of mRNA levels of the macrophage markers CD68 and F4/80 in kidney cortex of diabetic wild-type and khk−/− mice. (D) Quantification of mRNA ratio between inducible nitric oxide synthase (iNOS) and Arg1 in kidney cortex of diabetic wild-type and khk−/− mice. (n=6). D, diabetic wild-type; ND, nondiabetic wild-type. Mean±SEM. *P<0.05 versus diabetic khk−/−.
Figure 8.
Figure 8.
Fructokinase deficiency results in reduced macrophage infiltration in the diabetic kidney. (A) Representative kidney sections stained for CD68 in diabetic wild-type mice. Tubular area is shown. CD68 is represented in red pseudocolor and phalloidin (polymerized actin) is represented in green pseudocolor. Nuclei are counterstained with DAPI (blue). (B) Amplification from part A to better denote macrophage presence underlying the basal membrane of injured tubules (no apical membrane staining with phalloidin). (C) Representative kidney sections stained for CD68 in diabetic khk−/− mice. Tubular area is shown. (D) Quantification of CD68 positive cells per area in the tubular region in all groups. Original magnification, ×63 in A and C; ×40 in E and F. (E) Representative kidney sections stained for CD68 in diabetic wild-type mice. Glomerular area is shown. (F) Representative kidney sections stained for CD68 in diabetic khk−/− mice. Glomerular area is shown. (G) Quantification of CD68 positive cells per area in the glomerular region in all groups. (n=6). D, diabetic wild-type; ND, nondiabetic wild-type. Mean±SEM. *P<0.05 and **P<0.01 versus respective nondiabetic control; ##P<0.01.
Figure 9.
Figure 9.
Schematic of proposed mechanism whereby khk−/− mice show protection against diabetic nephropathy. Increased serum glucose causes direct glomerular and tubular injury. In the proximal tubule, glucose induces the transcription of AR, thus enhancing the production of endogenous sorbitol and fructose. Metabolism of endogenous fructose by KHK induces ATP depletion, uric acid generation, and oxidative stress in the proximal tubule, which further leads to the activation of the transcription factor NF-κB, cortical inflammation, and macrophage recruitment to the kidney cortex (M1 polarized) via generation of cytokines and chemokines. Activated macrophages exert toxicity in both glomerular and tubular areas. SDH, sorbitol dehydrogenase.

Comment in

Similar articles

Cited by

References

    1. Brenner BM, Cooper ME, de Zeeuw D, Keane WF, Mitch WE, Parving HH, Remuzzi G, Snapinn SM, Zhang Z, Shahinfar S, RENAAL Study Investigators : Effects of losartan on renal and cardiovascular outcomes in patients with type 2 diabetes and nephropathy. N Engl J Med 345: 861–869, 2001 - PubMed
    1. Nakayama T, Kosugi T, Gersch M, Connor T, Sanchez-Lozada LG, Lanaspa MA, Roncal C, Perez-Pozo SE, Johnson RJ, Nakagawa T: Dietary fructose causes tubulointerstitial injury in the normal rat kidney. Am J Physiol Renal Physiol 298: F712–F720, 2010 - PMC - PubMed
    1. Gersch MS, Mu W, Cirillo P, Reungjui S, Zhang L, Roncal C, Sautin YY, Johnson RJ, Nakagawa T: Fructose, but not dextrose, accelerates the progression of chronic kidney disease. Am J Physiol Renal Physiol 293: F1256–F1261, 2007 - PubMed
    1. Burch HB, Choi S, Dence CN, Alvey TR, Cole BR, Lowry OH: Metabolic effects of large fructose loads in different parts of the rat nephron. J Biol Chem 255: 8239–8244, 1980 - PubMed
    1. Diggle CP, Shires M, Leitch D, Brooke D, Carr IM, Markham AF, Hayward BE, Asipu A, Bonthron DT: Ketohexokinase: expression and localization of the principal fructose-metabolizing enzyme. J Histochem Cytochem 57: 763–774, 2009 - PMC - PubMed

Publication types

MeSH terms