. 2014 Sep;28(9):4026-35.
doi: 10.1096/fj.14-250886. Epub 2014 May 29.

Rab5a is required for spindle length control and kinetochore-microtubule attachment during meiosis in oocytes

Affiliations

Rab5a is required for spindle length control and kinetochore-microtubule attachment during meiosis in oocytes

Rujun Ma et al. FASEB J. 2014 Sep.

Abstract

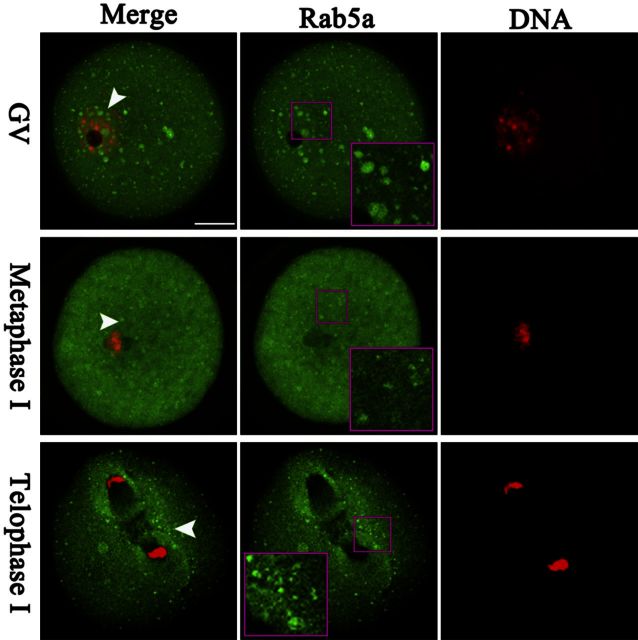
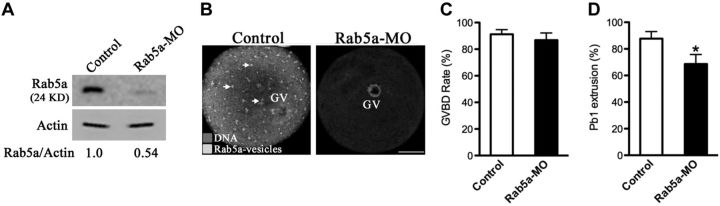
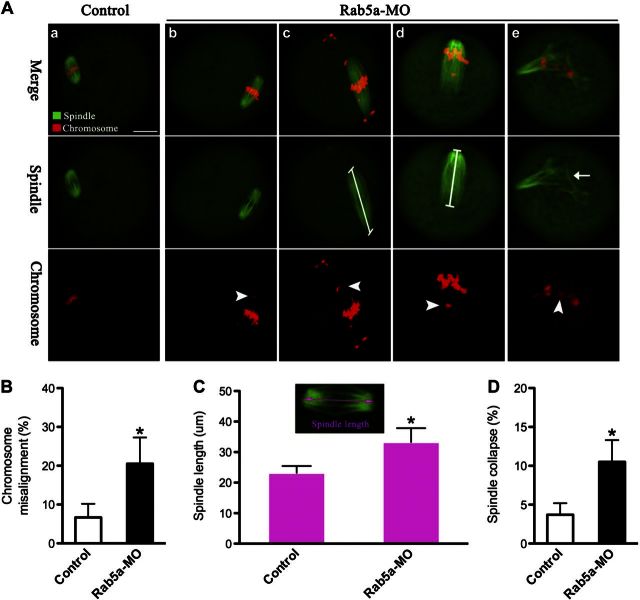
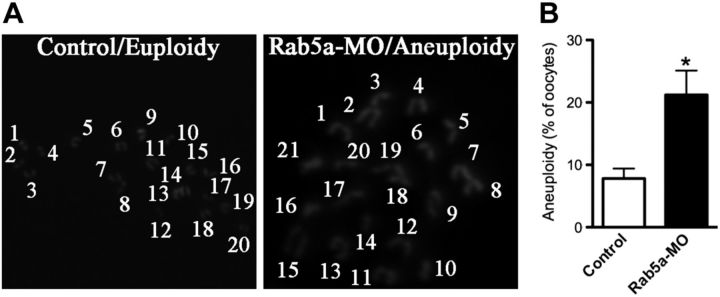
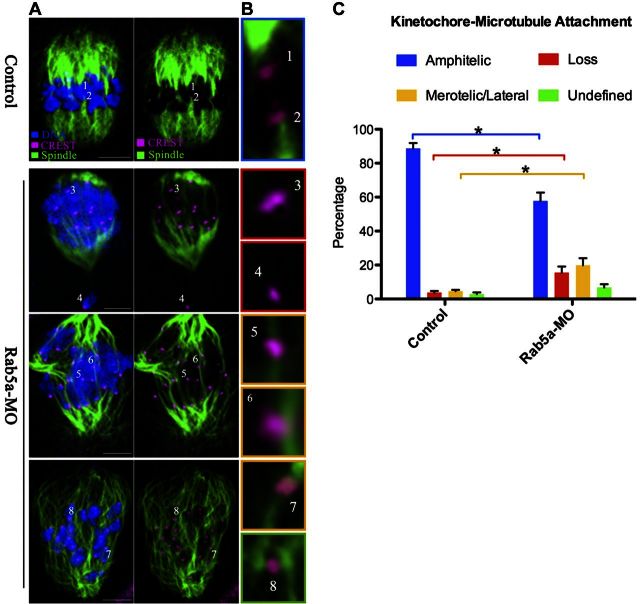
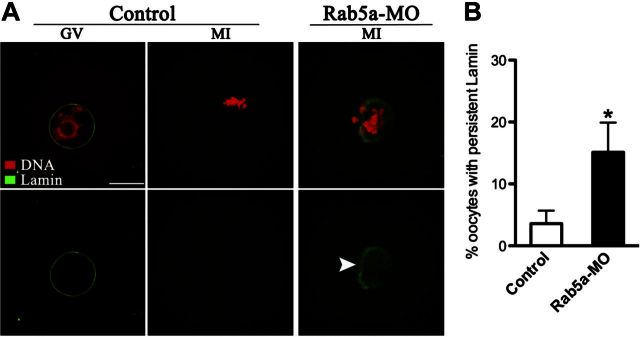
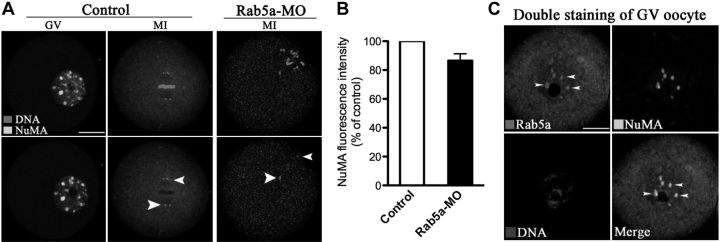
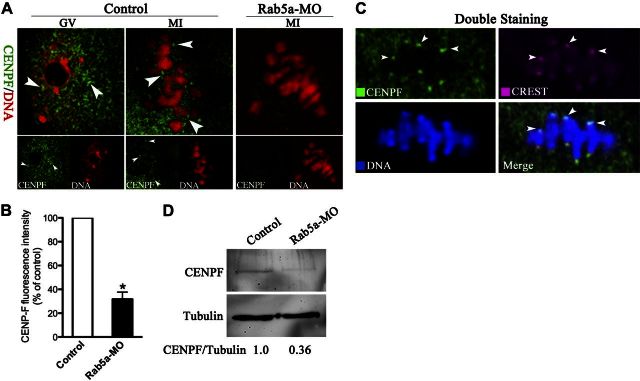
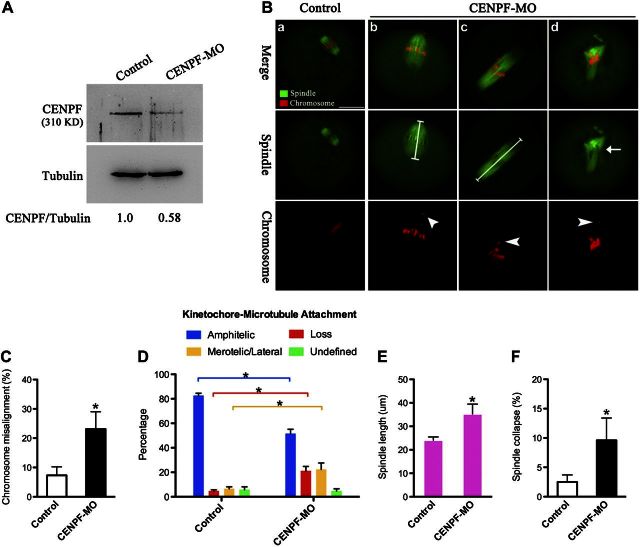
Rab GTPases are highly conserved components of vesicle trafficking pathways. Rab5, as a master regulator of endocytic trafficking, has been shown to function in membrane tethering and docking. However, the function of Rab5 in meiosis has not been addressed. Here, we report elongated spindles and misaligned chromosomes, with kinetochore-microtubule misattachments, on specific depletion of Rab5a in mouse oocytes. Moreover, the localization and levels of centromere protein F (CENPF), a component of the nuclear matrix, are severely reduced at kinetochores in metaphase oocytes following Rab5a knockdown. Consistent with this finding, nuclear lamina disassembly in the transition from prophase arrest to meiosis I is also impaired in Rab5a-depleted oocytes. Notably, oocyte-specific ablation of CENPF phenocopies the meiotic defects resulting from Rab5a knockdown. In summary, our data support a model where Rab5a-positive vesicles, likely through interaction with nuclear lamina, modulate CENPF localization and levels at centromeres, consequently ensuring proper spindle length and kinetochore-microtubule attachment in meiotic oocytes.

Keywords: CENPF; chromosome; vesicles.


Figures

Figure 1.
Figure 1.
Cellular distribution of Rab5-positive vesicles during oocyte meiosis. Oocytes at GV, MI, and telophase I stages were immunolabeled with Rab5a antibody (green) for vesicles and counterstained with PI for DNA (red) and visualized by confocal microscopy. Arrowheads indicate examples of Rab5a-positive vesicles. Outlined regions are magnified in inset; 30 oocytes were analyzed for each group. Scale bar = 25 μm.
Figure 2.
Figure 2.
Effects of Rab5a depletion on oocyte maturation. Fully grown oocytes microinjected with Rab5a-MO were arrested at GV stage with milrinone for 20 h to block mRNA translation and then cultured in milrinone-free medium to evaluate the meiotic progression by phase-contrast microscopy. A sham MO standard was injected as control. A) Western blot showing partial knockdown of Rab5a after MO injection with actin as a loading control. Band intensity was calculated using ImageJ software, and the ratio of Rab5a/actin expression was normalized, and values are indicated. B) Immunostaining showing the loss of Rab5a-positive vesicles in oocytes with MO injection. Arrows indicate vesicles. Scale bar = 25 μm. C, D) Quantitative analysis of GVBD (C) and Pb1 (D) extrusion in control (n=150) and Rab5a-MO (n=120) oocytes. Bars represent means ± sd of results obtained in 3 independent experiments. *P < 0.05 vs. control.
Figure 3.
Figure 3.
Proper spindle morphology and chromosome alignment in oocytes requires Rab5a. A) Control and Rab5a-MO oocytes were stained with α-tubulin antibody to visualize the spindle (green) and counterstained with PI to visualize chromosomes (red): control MII oocytes present a typical barrel-shaped spindle and well-aligned chromosomes on the metaphase plate (a); aberrant spindle (arrows) and misaligned chromosomes (arrowheads) were readily observed in Rab5a-MO MII oocytes (b–e). Representative confocal sections are shown. Scale bar = 25 μm. B) Quantification of control and Rab5a-MO oocytes with chromosome misalignment. C) Quantitative analysis of spindle length in control and Rab5a-MO oocytes. D) Quantification of control and Rab5a-MO oocytes with spindle collapse. Data are expressed as mean ± sd percentage from 3 independent experiments in which ≥100 oocytes were analyzed. *P < 0.05 vs. controls.
Figure 4.
Figure 4.
Increased aneuploidy in oocytes depleted of Rab5a. A) Chromosome spread of control and Rab5a-MO MII oocytes. Representative fluorescence images of euploid and aneuploid oocytes are shown. B) Quantification of aneuploidy in control and Rab5a-MO oocytes. Data are expressed as mean ± sd percentage; 30 oocytes/group were analyzed. *P < 0.05 vs. controls.
Figure 5.
Figure 5.
Correct K-MT attachments depend on Rab5a. A) Control and Rab5a-MO MI oocytes were stained with anti-tubulin (microtubules, green), CREST (kinetochore, purple), and Hoechst 33342 (chromosomes, blue). Representative confocal sections are shown. B) Magnified views for the K-MT attachments in the oocytes shown in A. Kinetochore-microtubule attachments are classified into 4 categories: amphitelic (chromosomes 1 and 2), loss (chromosome 3 and 4), merotelic/lateral (chromosome 5–7), and undefined (chromosome 8) attachment. Image border colors correspond to the categories. C) Quantitative analysis of K-MT attachments in oocytes as indicated. Attachment of kinetochores to microtubules was assessed through examination of the full series of Z-axis focal planes. Kinetochores in regions where fibers were not easily visualized were not included in the analysis; 10 control oocytes and 8 Rab5a-MO oocytes were analyzed. Scale bars = 10 μm. *P < 0.05 vs. controls.
Figure 6.
Figure 6.
Depletion of Rab5a impairs nuclear lamina disassembly in oocytes. A) Control and Rab5a-MO oocytes were labeled with anti-lamin A/C antibody (green) and counterstained with PI to visualize chromosomes (red). Representative images of GV and MI oocytes are shown. Arrowhead in Rab5a-MO MI oocyte shows residual nuclear lamina as judged by lamin A/C staining. Scale bar = 25 μm. B) Quantification of control and Rab5a-MO oocytes showing persistent lamin at metaphase stage. At least 50 oocytes were counted for each group. Bars represent means ± sd. *P < 0.05 vs. controls.
Figure 7.
Figure 7.
Loss of Rab5a in oocytes has no effect on NuMA localization and levels. A) Control and Rab5a-MO oocytes were labeled with anti-NuMA antibody (green) and counterstained for chromosomes (red). Arrowheads indicate NuMA localization. Representative images of GV and MI oocytes are shown. Scale bar = 25 μm. B) Quantification of NuMA staining in control and Rab5a-MO MI oocytes. At least 50 oocytes were analyzed for each experiment. C) Double staining of GV oocytes with anti-NuMA and anti-Rab5a antibodies. Error bars indicate ± sd.
Figure 8.
Figure 8.
Rab5a Depletion reduces the CENPF localization/levels on kinetochores in oocytes. A) Control and Rab5a-MO oocytes were labeled with anti-CENPF antibody (green) and counterstained for chromosomes (red). Representative images of GV and MI oocytes are shown; arrowheads indicate CENPF localization. B) Quantification of CENPF staining in control and Rab5a-MO oocytes; 30 oocytes/group were analyzed. C) Double staining of metaphase oocytes with CREST antibody (red) and CENPF antibody (green), and counterstaining of chromosome with Hoechst 33342 (blue), confirming the CENPF puncta colocalization with kinetochores (arrowheads). D) Western blot showing the dramatically reduced CENPF protein levels in oocytes following Rab5a knockdown, with tubulin as a loading control. Bars represent means ± sd. *P < 0.05 vs. controls.
Figure 9.
Figure 9.
CENPF knockdown phenocopies the spindle/chromosome defects resulting from Rab5a depletion. A) Reduced CENPF levels after CENPF-MO injection were confirmed by Western blot. Tubulin served as a loading control. Band intensity was calculated using ImageJ; ratio of CENPF/tubulin expression was normalized, and values are indicated. B) Control and CENPF-MO oocytes were stained with α-tubulin antibody to visualize the spindle (green) and counterstained with PI to observe chromosomes (red). Representative examples of spindle and chromosomes in control MII oocytes (a) and CENPF-MO oocytes (b–d). Arrow indicates the abnormal spindle; arrowheads indicate misaligned chromosomes. Scale bar = 25 μm. C) Quantification of control (n=110) and CENPF-MO (n=100) oocytes with chromosome misalignment. D) Quantitative analysis of K-MT attachments in oocytes as indicated (10 control oocytes and 10 CENPF-MO oocytes). E) Quantitative analysis of spindle length in control (n=45) and CENPF-MO (n=50) oocytes. F) Quantification of control (n=110) and CENPF-MO (n=100) oocytes with spindle collapse. Data are expressed as mean ± sd percentage. *P < 0.05 vs. controls.

Similar articles

Cited by

References

    1. Krisher R. L. (2004) The effect of oocyte quality on development. J. Animal Sci. 82(E-Suppl.), E14–E23 - PubMed
    1. Hassold T., Hunt P. (2001) To err (meiotically) is human: the genesis of human aneuploidy. Nat. Rev. Genet. 2, 280–291 - PubMed
    1. Barr F. A. (2013) Review series: Rab GTPases and membrane identity: causal or inconsequential? J. Cell Biol. 202, 191–199 - PMC - PubMed
    1. Stenmark H. (2009) Rab GTPases as coordinators of vesicle traffic. Nat. Rev. Mol. Cell Biol. 10, 513–525 - PubMed
    1. Liu Z., Zheng Y. (2009) A requirement for epsin in mitotic membrane and spindle organization. J. Cell Biol. 186, 473–480 - PMC - PubMed

Publication types

MeSH terms

LinkOut - more resources