

Consequences of Whole-Genome Triplication as Revealed by Comparative Genomic Analyses of the Wild Radish Raphanus raphanistrum and Three Other Brassicaceae Species
- PMID: 24876251
- PMCID: PMC4079359
- DOI: 10.1105/tpc.114.124297
Consequences of Whole-Genome Triplication as Revealed by Comparative Genomic Analyses of the Wild Radish Raphanus raphanistrum and Three Other Brassicaceae Species
Abstract
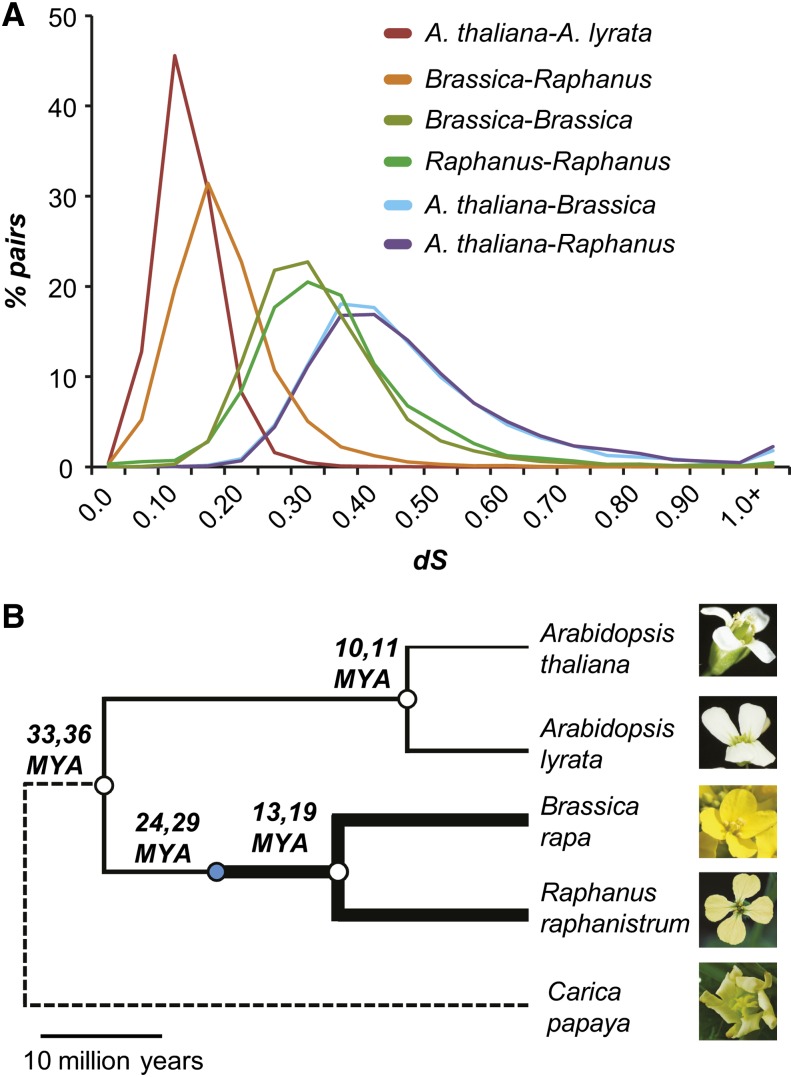
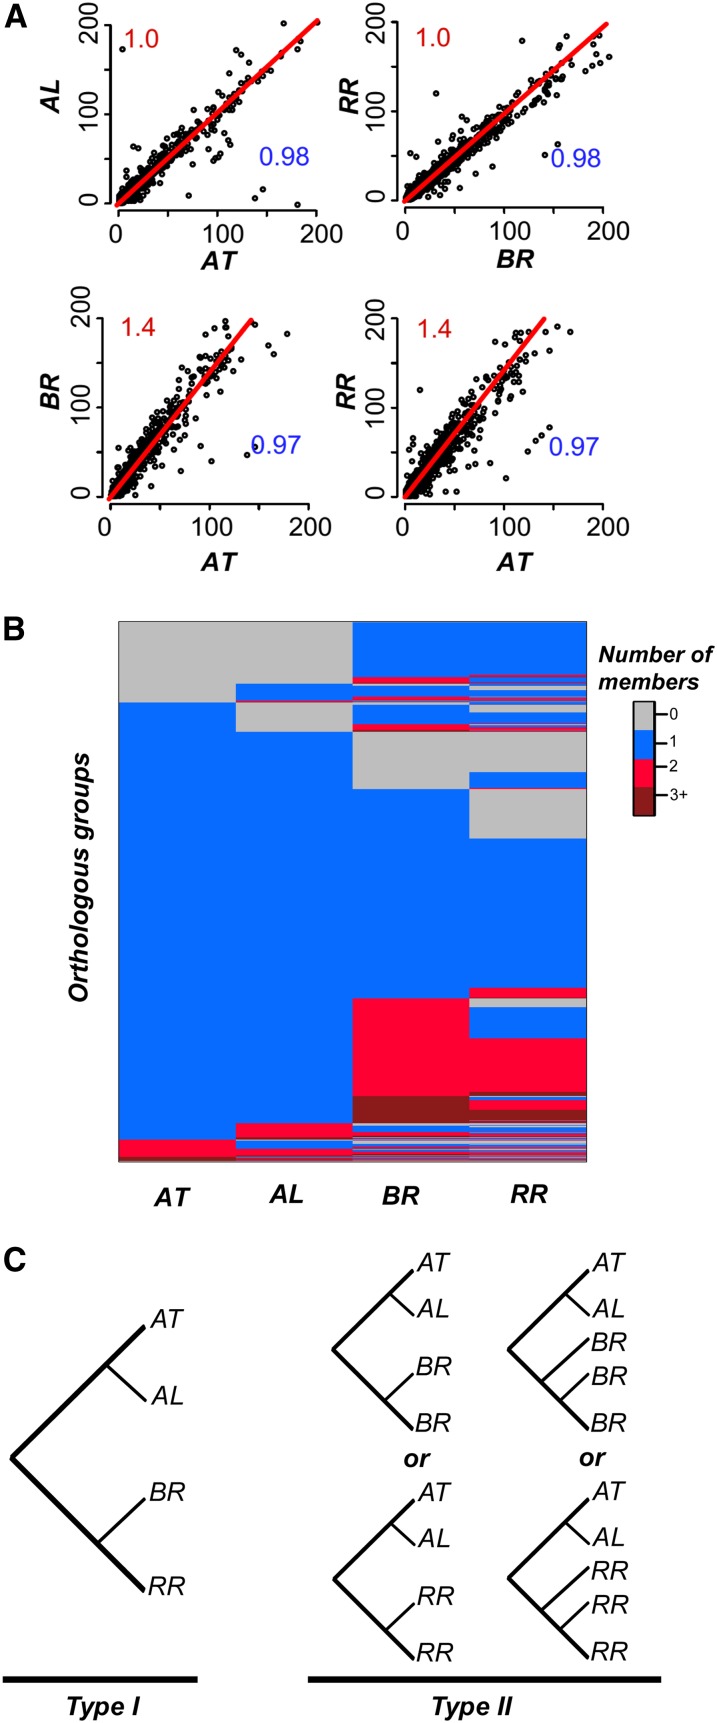
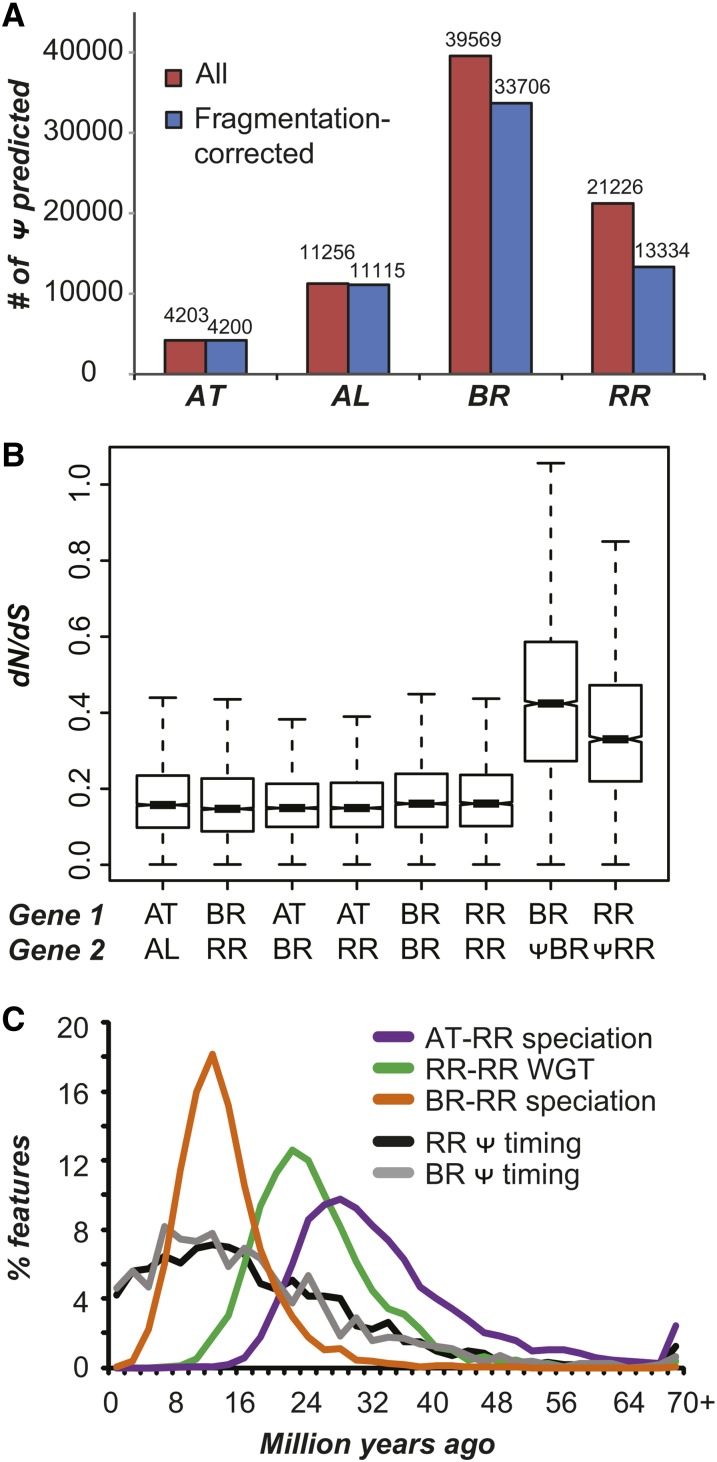
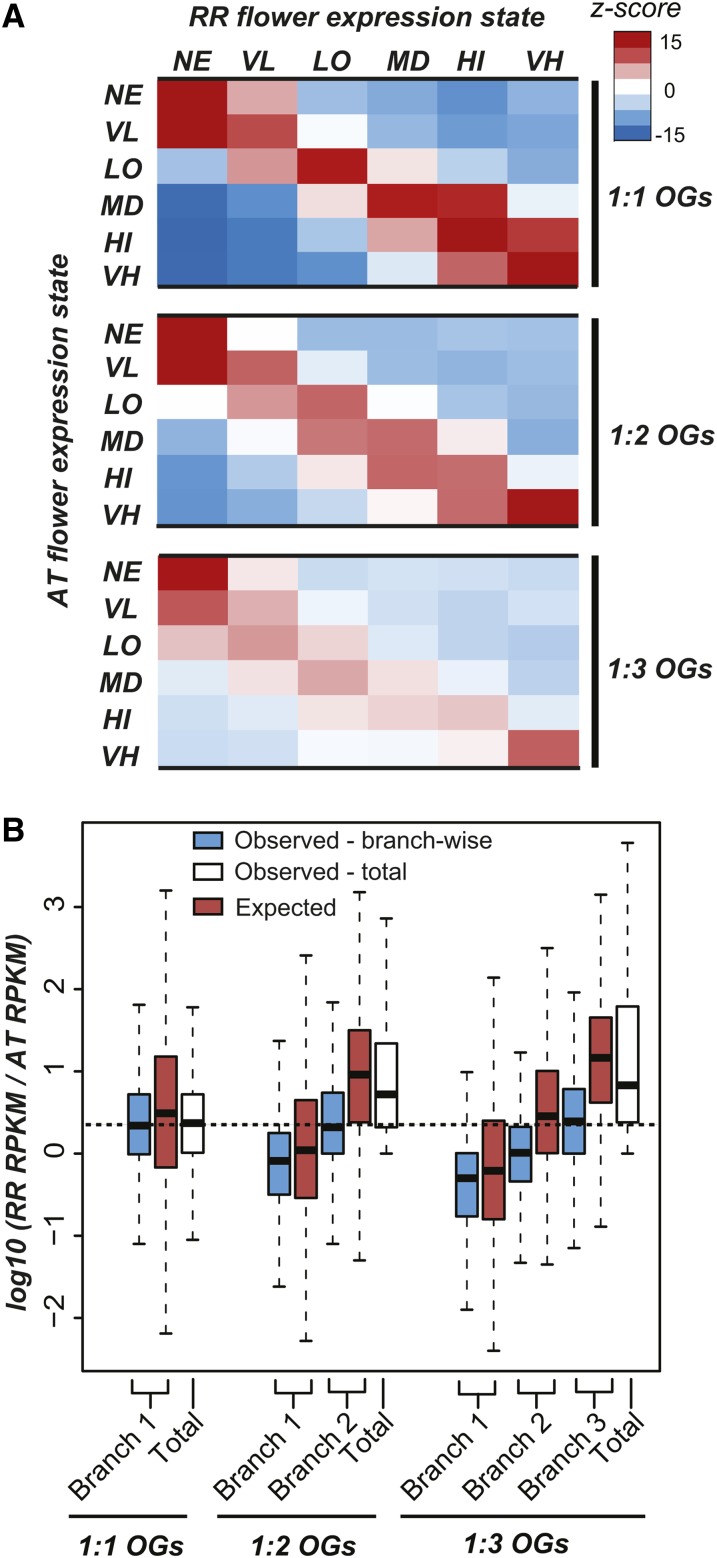
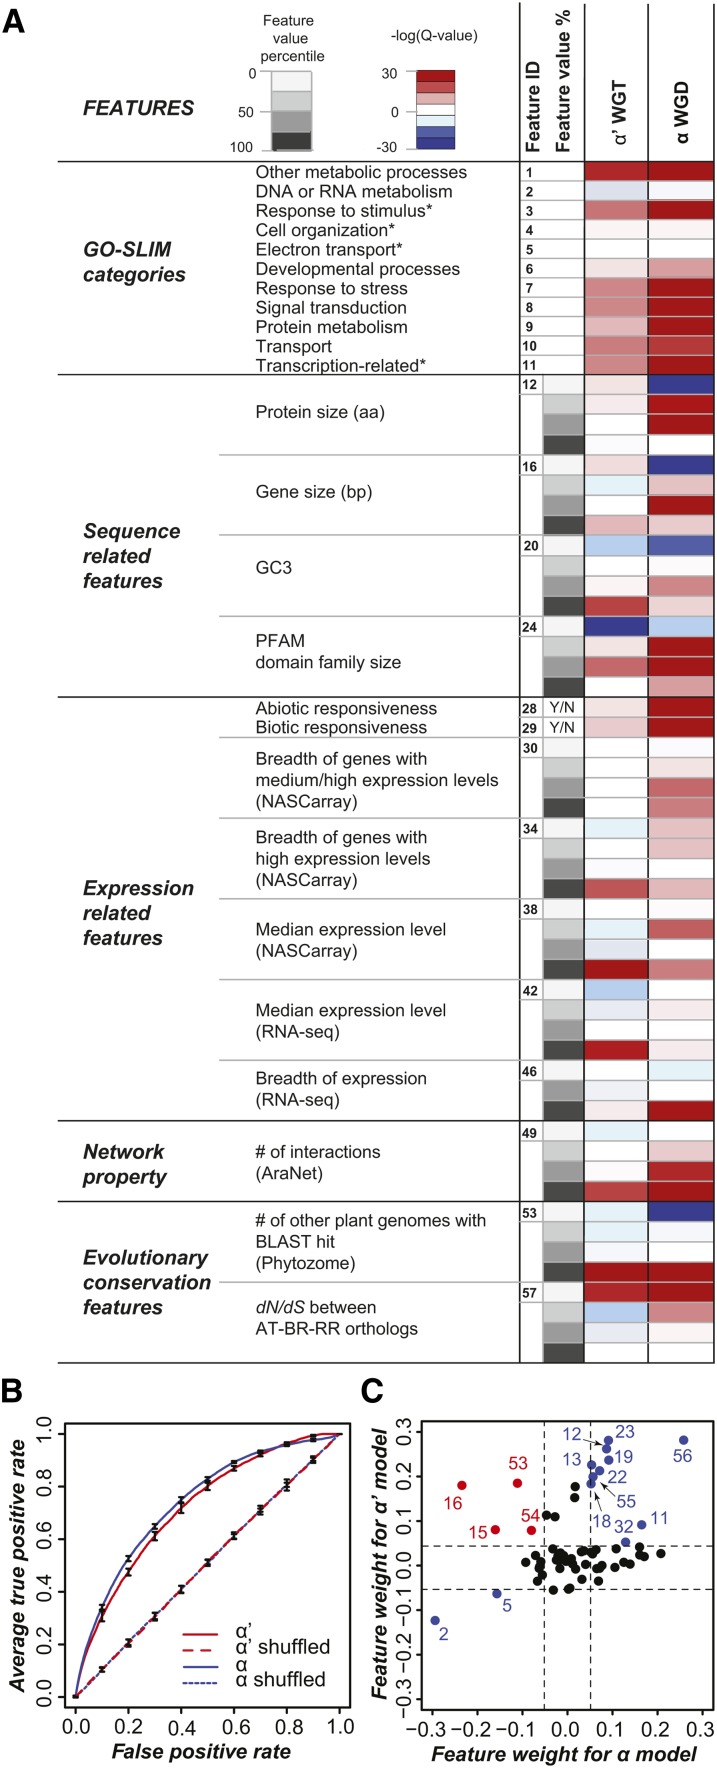
Polyploidization events are frequent among flowering plants, and the duplicate genes produced via such events contribute significantly to plant evolution. We sequenced the genome of wild radish (Raphanus raphanistrum), a Brassicaceae species that experienced a whole-genome triplication event prior to diverging from Brassica rapa. Despite substantial gene gains in these two species compared with Arabidopsis thaliana and Arabidopsis lyrata, ∼70% of the orthologous groups experienced gene losses in R. raphanistrum and B. rapa, with most of the losses occurring prior to their divergence. The retained duplicates show substantial divergence in sequence and expression. Based on comparison of A. thaliana and R. raphanistrum ortholog floral expression levels, retained radish duplicates diverged primarily via maintenance of ancestral expression level in one copy and reduction of expression level in others. In addition, retained duplicates differed significantly from genes that reverted to singleton state in function, sequence composition, expression patterns, network connectivity, and rates of evolution. Using these properties, we established a statistical learning model for predicting whether a duplicate would be retained postpolyploidization. Overall, our study provides new insights into the processes of plant duplicate loss, retention, and functional divergence and highlights the need for further understanding factors controlling duplicate gene fate.
© 2014 American Society of Plant Biologists. All rights reserved.
Figures
Similar articles
-
Genome-wide identification, characterization, and evolutionary analysis of flowering genes in radish (Raphanus sativus L.).BMC Genomics. 2017 Dec 19;18(1):981. doi: 10.1186/s12864-017-4377-z. BMC Genomics. 2017. PMID: 29258434 Free PMC article.
-
Genome-wide comparative analysis of NBS-encoding genes between Brassica species and Arabidopsis thaliana.BMC Genomics. 2014 Jan 3;15(1):3. doi: 10.1186/1471-2164-15-3. BMC Genomics. 2014. PMID: 24383931 Free PMC article.
-
Syntenic gene analysis between Brassica rapa and other Brassicaceae species.Front Plant Sci. 2012 Aug 30;3:198. doi: 10.3389/fpls.2012.00198. eCollection 2012. Front Plant Sci. 2012. PMID: 22969786 Free PMC article.
-
Genome triplication drove the diversification of Brassica plants.Hortic Res. 2014 May 21;1:14024. doi: 10.1038/hortres.2014.24. eCollection 2014. Hortic Res. 2014. PMID: 26504539 Free PMC article. Review.
-
Genome Triplication Leads to Transcriptional Divergence of FLOWERING LOCUS C Genes During Vernalization in the Genus Brassica.Front Plant Sci. 2021 Feb 9;11:619417. doi: 10.3389/fpls.2020.619417. eCollection 2020. Front Plant Sci. 2021. PMID: 33633752 Free PMC article. Review.
Cited by
-
Lineage isolation in the face of active gene flow in the coastal plant wild radish is reinforced by differentiated vernalisation responses.BMC Evol Biol. 2016 Apr 16;16:84. doi: 10.1186/s12862-016-0655-7. BMC Evol Biol. 2016. PMID: 27083979 Free PMC article.
-
Characterization of the OFP Gene Family and its Putative Involvement of Tuberous Root Shape in Radish.Int J Mol Sci. 2020 Feb 14;21(4):1293. doi: 10.3390/ijms21041293. Int J Mol Sci. 2020. PMID: 32075122 Free PMC article.
-
Interspecific hybridization, polyploidization, and backcross of Brassica oleracea var. alboglabra with B. rapa var. purpurea morphologically recapitulate the evolution of Brassica vegetables.Sci Rep. 2016 Jan 4;6:18618. doi: 10.1038/srep18618. Sci Rep. 2016. PMID: 26727246 Free PMC article.
-
PTGBase: an integrated database to study tandem duplicated genes in plants.Database (Oxford). 2015 Mar 22;2015:bav017. doi: 10.1093/database/bav017. Print 2015. Database (Oxford). 2015. PMID: 25797062 Free PMC article.
-
Evolutionary reconstruction, nomenclature and functional meta-analysis of the Kiwellin protein family.Front Plant Sci. 2022 Dec 22;13:1034708. doi: 10.3389/fpls.2022.1034708. eCollection 2022. Front Plant Sci. 2022. PMID: 36618657 Free PMC article.
References
-
- Arabidopsis Genome Initiative (2000). Analysis of the genome sequence of the flowering plant Arabidopsis thaliana. Nature 408: 796–815 - PubMed
-
- Arumuganathan K., Earle E.D. (1991). Nuclear DNA content of some important plant species. Plant Mol. Biol. Rep. 9: 208–218
LinkOut - more resources
Full Text Sources
Other Literature Sources
Molecular Biology Databases
